What's Next for CBRE Group After Earnings Drive Stock Price Surge?
As the commercial real estate sector faces an uncertain future, we project the best trade strategy for CBRE Group.
You've reached your free article limit
You've read 0 of 1 free Pro articles.
CBRE Group Inc CBRE is a provider of integrated services to commercial real estate investors and occupiers. The stock has been interesting as the sector experiences some turmoil, with CBRE share prices jumping on stronger core earnings outlook in the last week and breaking out of an eight-month sideways consolidation pattern.
What can we anticipate next?
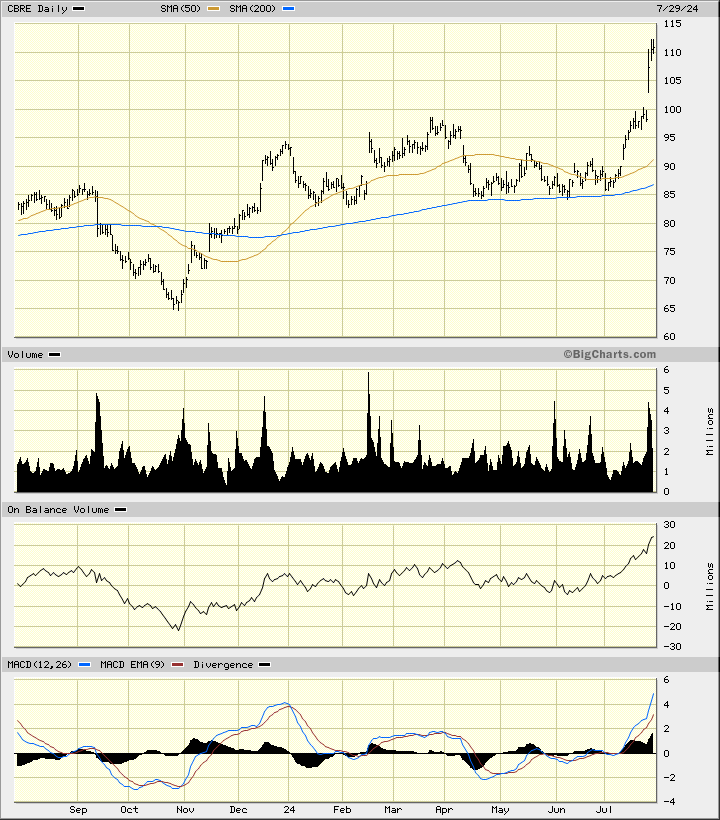
In this daily bar chart of CBRE below, I can see that prices broke out above the highs of March and April. CBRE trades above the rising 50-day moving average line and above the rising 200-day line. The On-Balance-Volume (OBV) line has climbed to a new high for the move up to confirm the price gains we have seen. The Moving Average Convergence Divergence (MACD) oscillator is in a bullish alignment above the zero line.
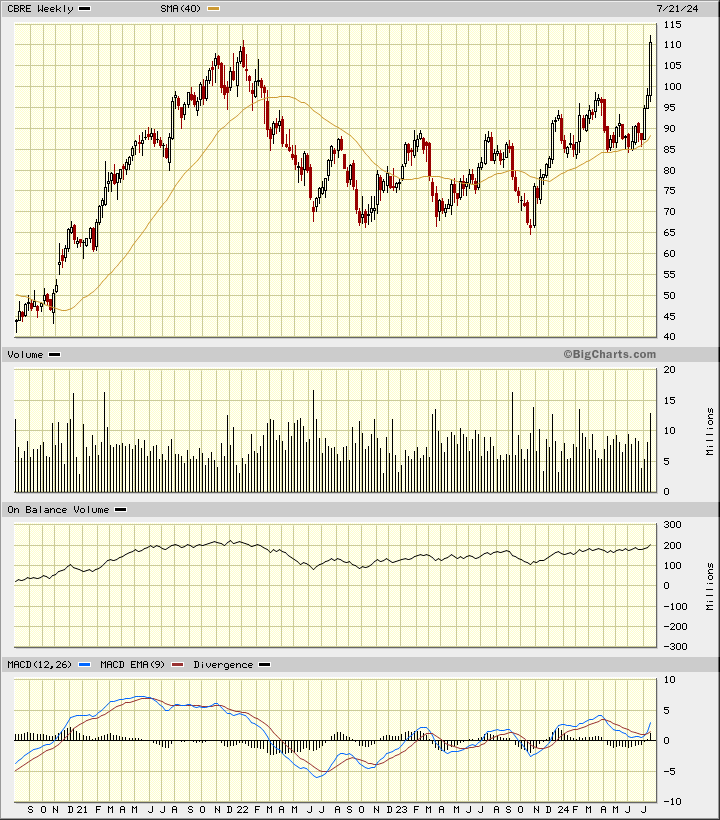
In this weekly Japanese candlestick chart of CBRE below, I can see an impressive "upper level" base pattern. Prices trade above the rising 40-week moving average line. The weekly OBV line shows a positive trend over the past two years. The MACD oscillator has recently turned higher from above the zero line for a fresh buy signal.
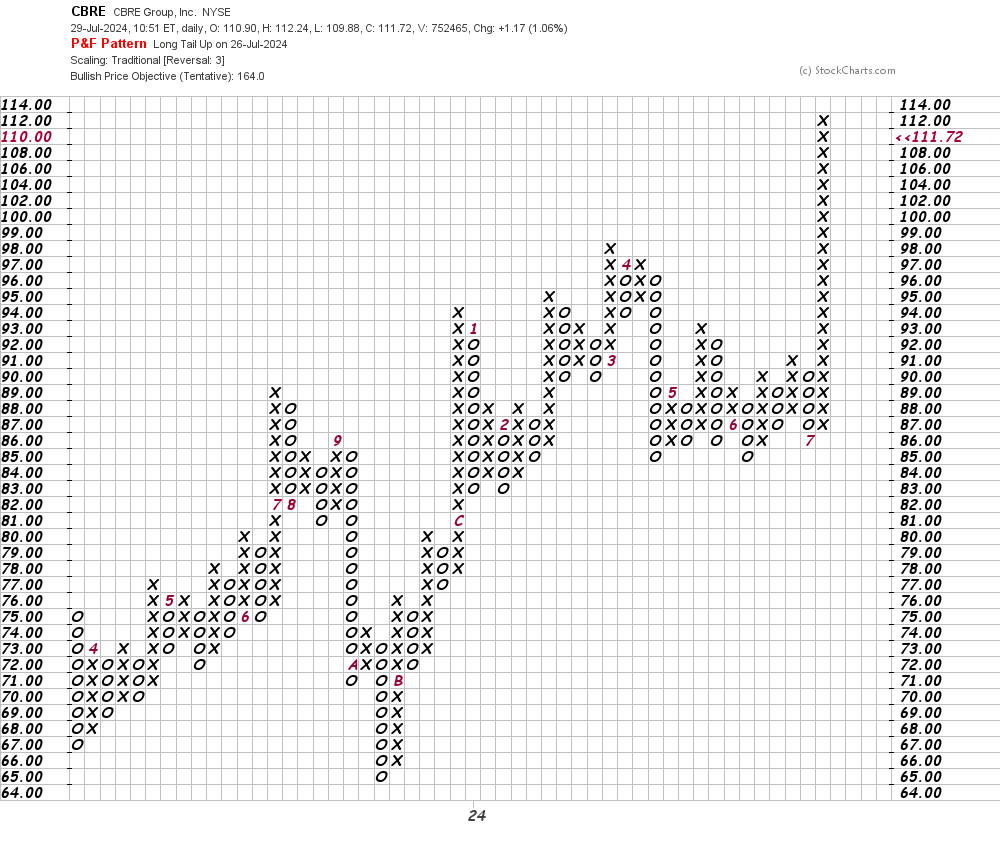
In this daily Point and Figure chart of CBRE below, I can see an upside price target in the $164 area.
In this weekly Point and Figure chart of CBRE below, I can see the same $164 price target as shown on the daily chart above.
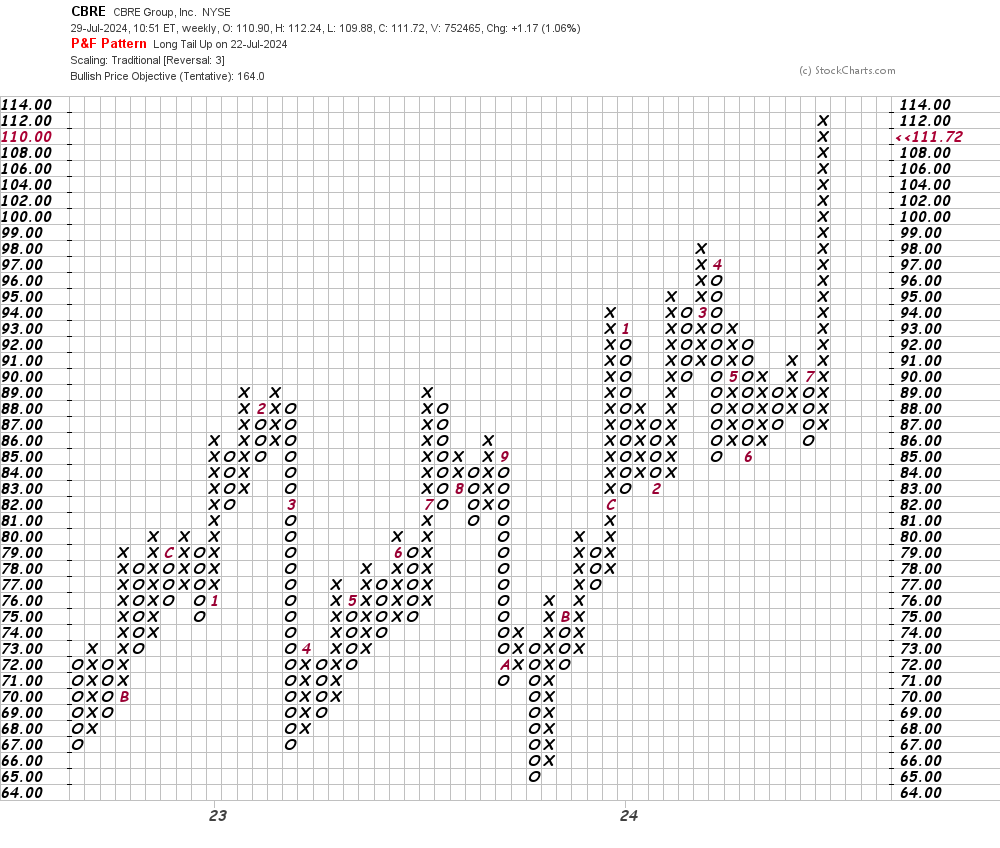
Bottom line strategy: Traders could try to buy a dip in CBRE below the $110 level. Risk to $100 and the $164 area is my price target.
Employees of TheStreet are prohibited from trading individual securities.