Carnival Doesn't Look Fit for a Long Trip Yet
The charts still look pretty rocky, despite earnings beat. Let's take a look.
You've reached your free article limit
You've read 0 of 1 free Pro articles.
Tuesday morning Carnival Corp CCL reported adjusted earnings per share of $0.11 and revenue of $5.78 billion, which beat analysts' estimates.
Prices are trading higher Tuesday, but the question is whether this a breakout move or just a bounce in a sideways to higher trend.
Let's check.
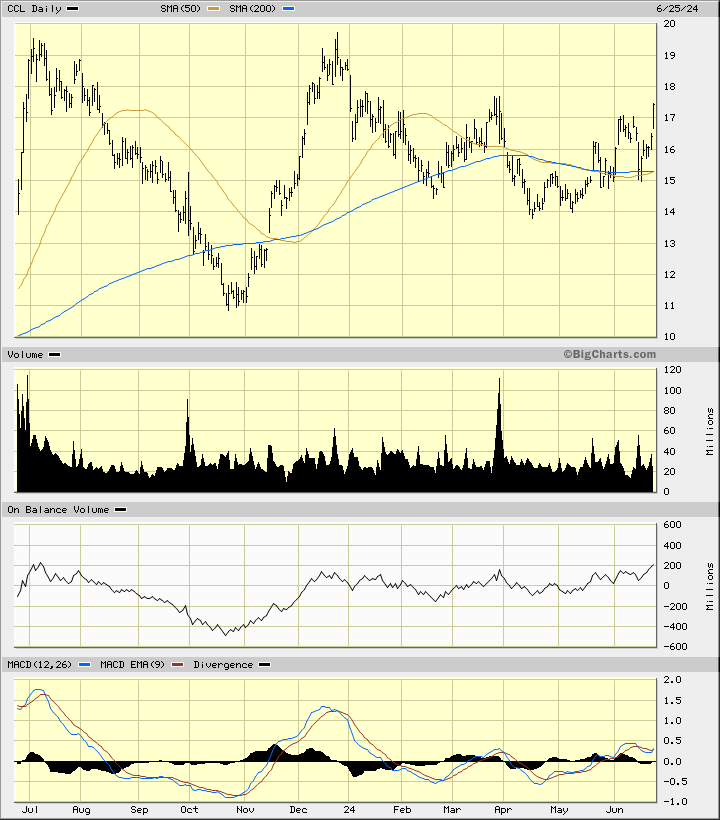
In this daily bar chart of CCL, below, I see a mixed chart setup. Prices have rallied from a low in April but the popular moving averages are still flat. The trading volume has not ramped up, but the On-Balance-Volume (OBV) line has improved. The Moving Average Convergence Divergence (MACD) oscillator is only moderately above the zero-line.
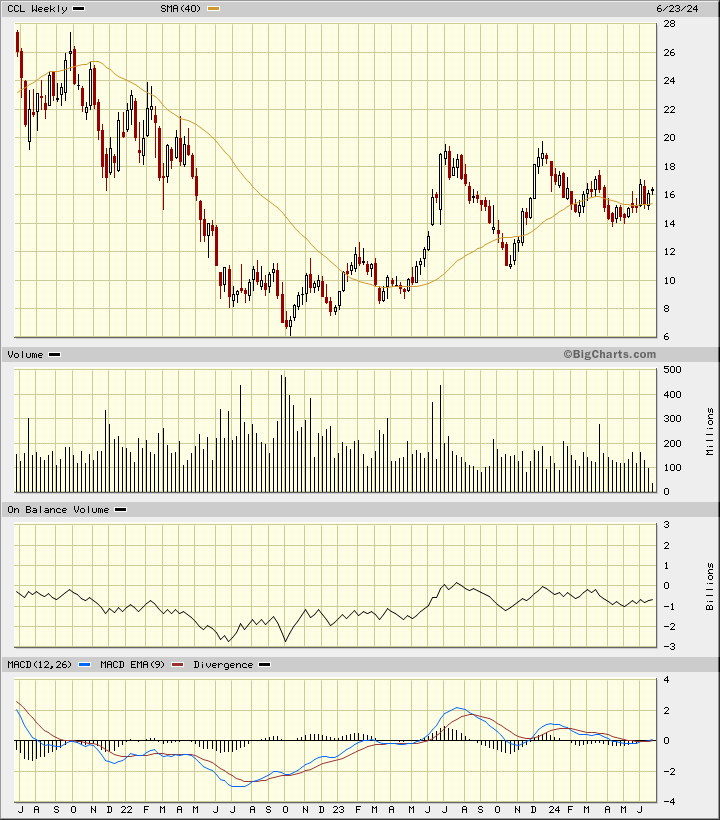
In this weekly Japanese candlestick chart of CCL, below, I can see that prices have been moving sideways in a large triangle formation. Prices have been trading around the 40-week moving average line. The weekly OBV line has moved sideways the past twelve months. The MACD oscillator is hugging the zero-line.
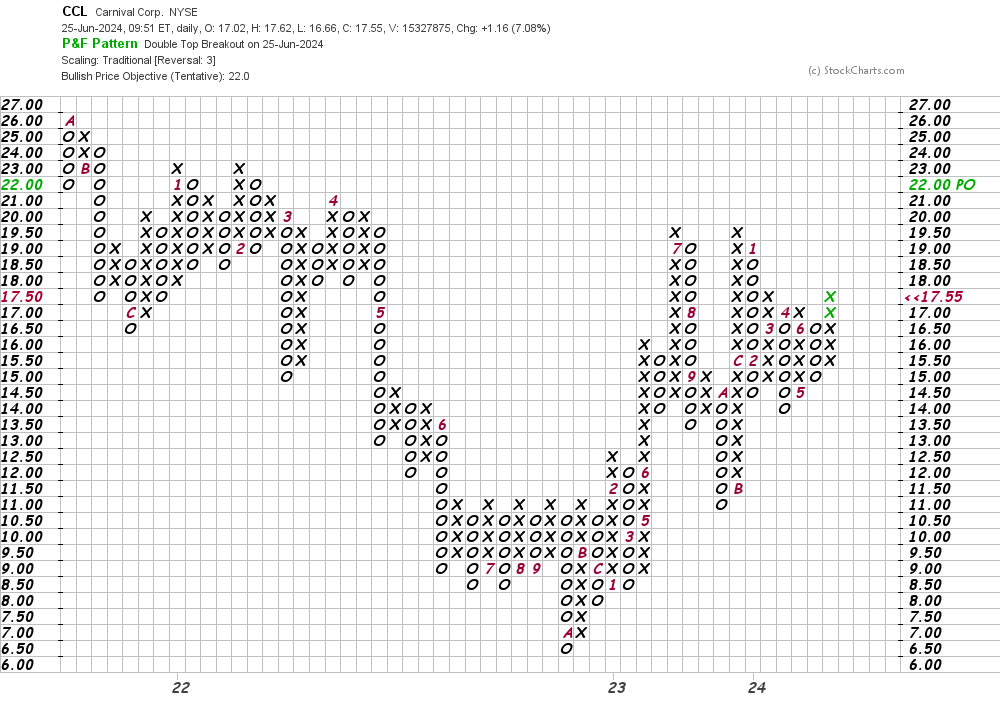
In this daily Point and Figure chart of CCL, below, I can see an upside price target in the $22 area. Not all that impressive.
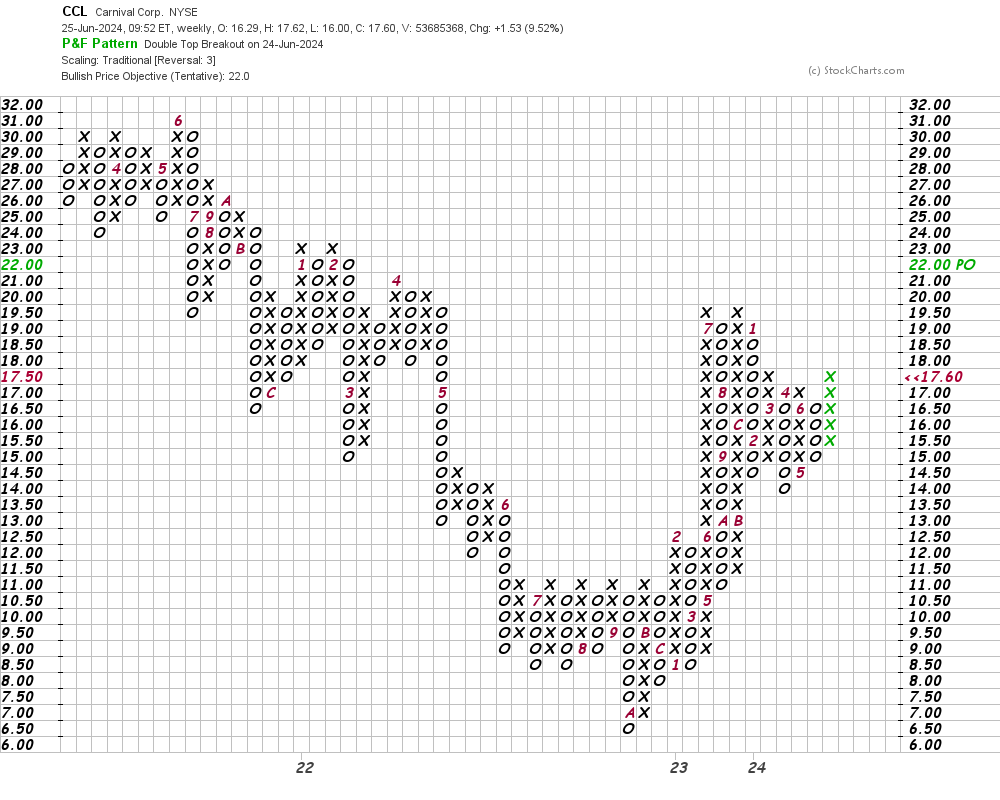
In this weekly Point and Figure chart of CCL, below, I can see the same $22 price target as the daily chart above.
Bottom line strategy: CCL is trading in the middle of its high/low range for Tuesday. It is a long way until the close so anything could happen but this snapshot in time suggests that CCL is not ready for a round the world cruise. A breakout over $20 will be more impressive if or when it happens.
Employees of TheStreet are prohibited from trading individual securities.