Blowoff Tops Are Rare. But Is That What We’re Seeing Now?
With few people willing to admit they’re bearish, are we nearing a top in the market?
You've reached your free article limit
You've read 0 of 1 free Pro articles.

The Market
Today felt like a day of rest. Or did it feel like the shorts finally finished covering and there were very few buyers around to keep us levitated? I’m inclined to think it was a bit of both.
You see, for the first time since the rally started late last week, the volume in the QQQs tailed off. It has been my contention that the frenzy to buy was started with shorts running to cover. You might recall at the time, I said that Bob Prechter always said all rallies begin with short covering. I would add the corollary: then you need real buying to come in. Today did not see buying but rather milling around.
Yesterday’s put/call ratio of .69 was the lowest since late May. So was the equity and index put/call ratios. And there was record volume in call options. This has brought up a question I should address: Is this a blow-off top?
Let me say from the beginning that crashes and blow-off tops are outliers. They tend to be used as dramatic clickbait terms, so you will not find me using them. With that having been said, those options volumes are eye-popping, especially when they show up at highs, not coming off lows.
Then there is the Investors’ Intelligence bulls, which chimed in at 53.7%. Okay, so they jumped up four points this week. But they only encompass trading through last Friday, and recall Friday, the market sold off into the bell.
But it’s the bears I want to focus on. They are now down to 14.8%. This is the lowest reading since late February, so that’s not great from a sentiment standpoint. Prior to that, we saw 13.5% bears in late October. So the bears are quite scarce, which is generally not bullish (and a reminder, this is tallied through last Friday).
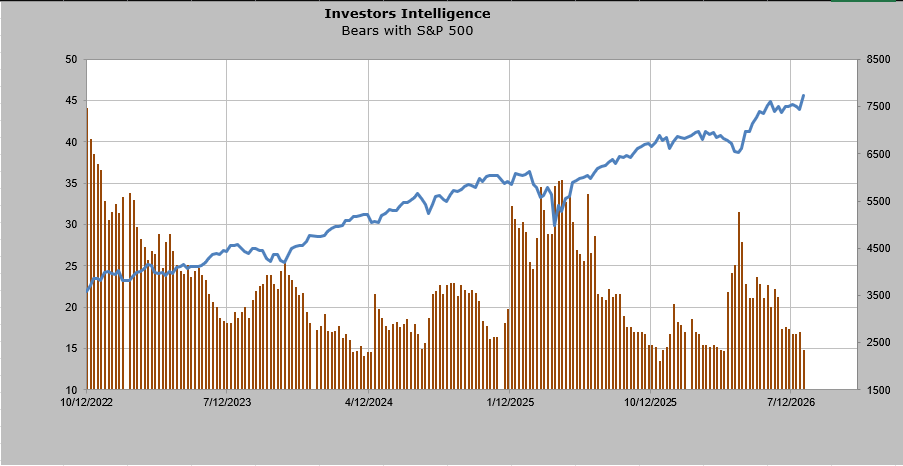
But if I had to cite something that I think is bearish, the ratio of bulls to bears is 3.63, which is the highest since late October when it ticked over 4.0. Again, let’s say the market doesn’t fall apart between now and Friday, and those bulls just lift to, say, 56%, that would put the ratio at 3.8. Sometimes that is enough to get a decent pullback in the market. But readings over 4.0 have rarely seen the market keep on going. And if we get that, that would solidify my view that we are apt to see the others (and maybe tech too) come back down in August.
New Ideas
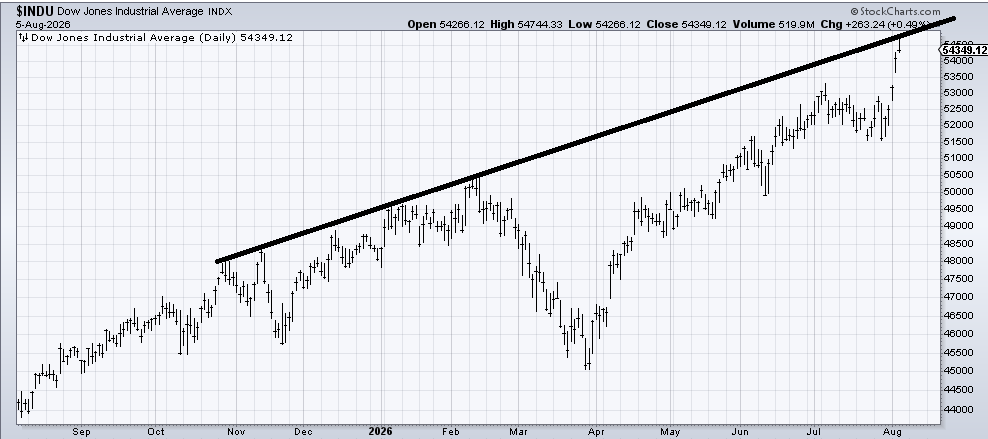
I rarely show a chart of the Dow, but I was asked today about its outperformance and if I thought it would continue. This line has kept the rally in the DJIA in check since November last year. I wouldn’t be surprised to see it try and rally again, but I don’t think it gets through easily. Not without a pullback.
Today’s Indicator
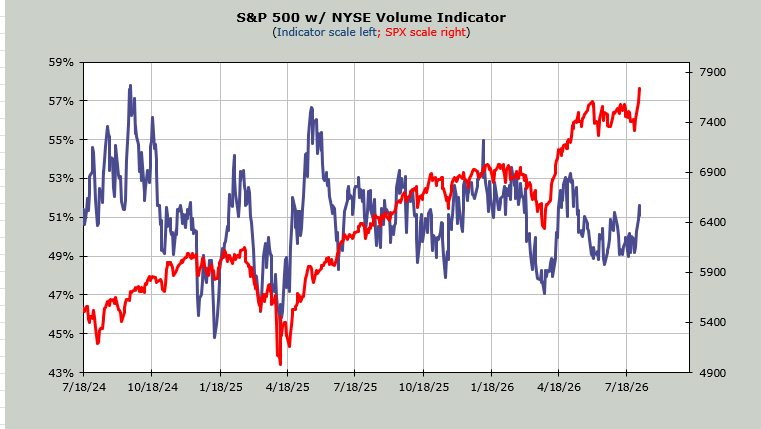
The Volume Indicator is at 51%.
Q&A/Reader’s Feedback
Helene welcomes your questions about Top Stocks and her charting strategy and techniques. Please send an email directly to Helene with your questions. However, please remember that TheStreet.com Top Stocks is not intended to provide personalized investment advice. Email Helene here.
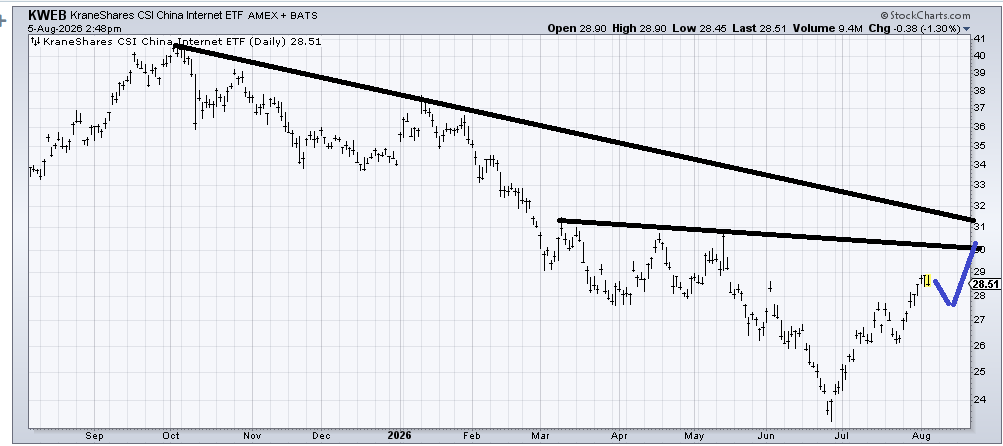
(KWEB), an ETF to be long Chinese internet stocks, is attempting a bottom. But there is a lot to chew through. I get the sense the chart will pull back and then rally again. I would want to assess the rally after the pullback because if it can only get to 30, then we’re looking at another lower high. If it can make it to 31, then we have a change in character.
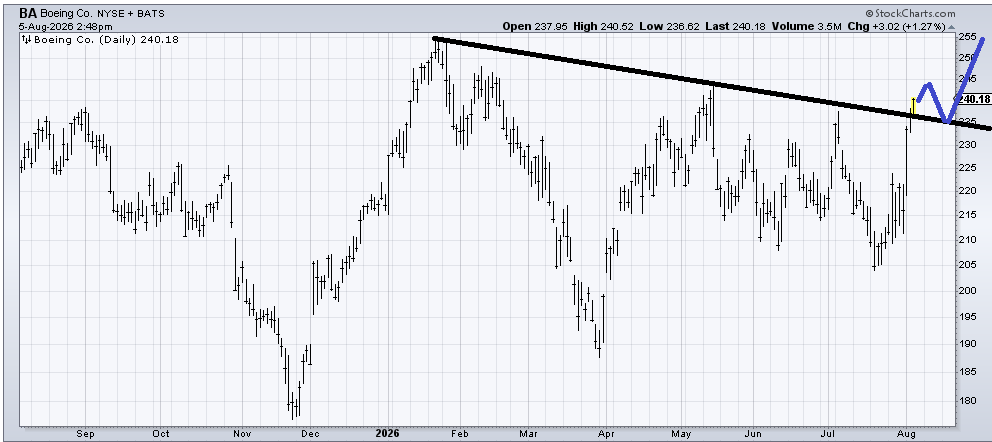
Let’s see if Boeing (BA) can map out something akin to what I have drawn in blue. BA has not made a higher high all year, so that’s the first step. I would not chase it up here, but if it pulls back to 235 (tests the line) and holds, I’d be a buyer.
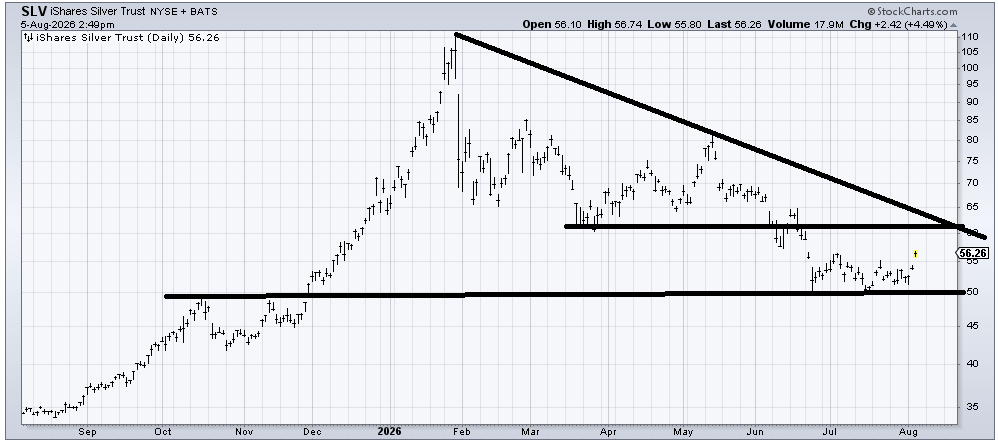
I continue to think (SLV), an ETF to be long Silver, had a bubble that popped in January. I do think SLV could rally to that 60-ish area of resistance
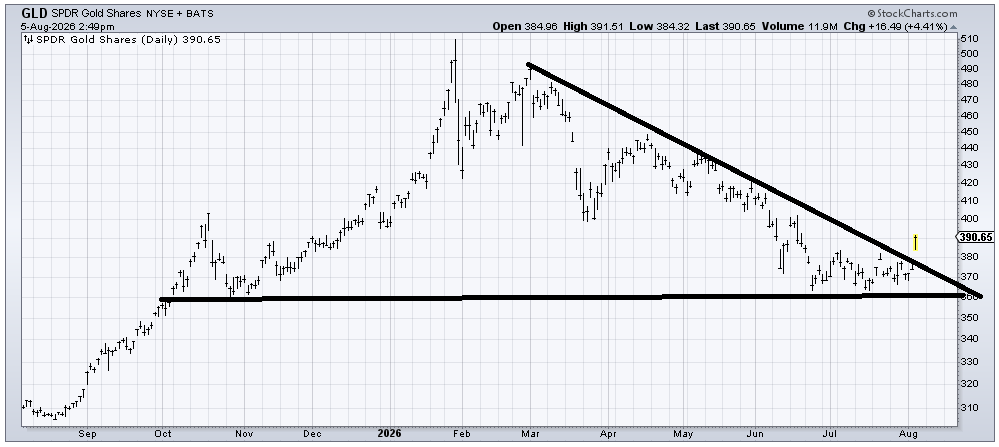
I have been a fan of (GLD), an ETF to be long Gold, since late June when the DSI got to 10. I have consistently said as long as it doesn’t break 360, it’s good. It will run into some resistance in that 400 area, but crossing that downtrend line was key. I have not raised the stop yet.