Are the Utilities Ready to Make a Charge Higher?
Ten straight red days for the utilities. Could a bottom near support be what they need to move higher?
You've reached your free article limit
You've read 0 of 1 free Pro articles.

The Market
So, we had two semiconductor stocks down big on the day, and still the SOX clawed its way back to slightly up. And the charts of those two stocks (WDC and SNDK)? Still within the wide range they have been in. In other words, there is a lot of back and forth, which means the charts haven’t changed much.
I do, however, want to once again note that for all that chatter about broadening out, the breadth has been negative for two days now, and despite the surge in the major indexes in the last week, there has been no breadth thrust.
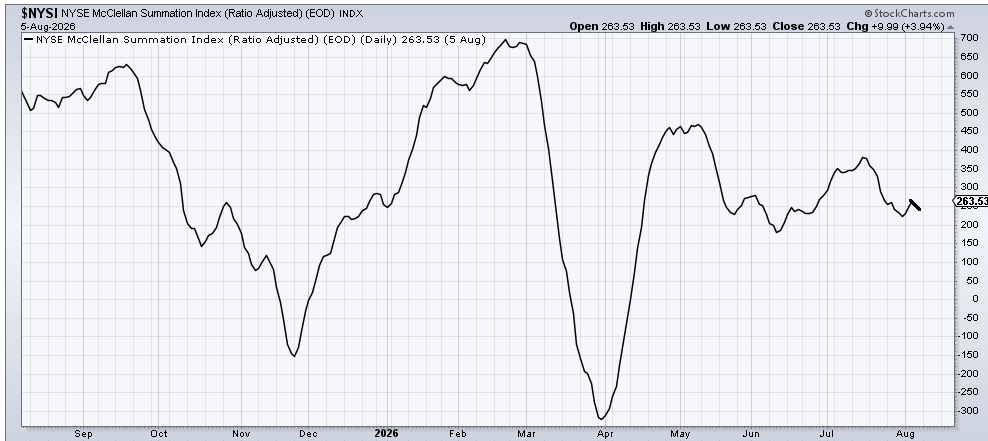
I should also point out that the McClellan Summation Index ticked down today, after barely rising during the rally. I still believe the others catch down in August.
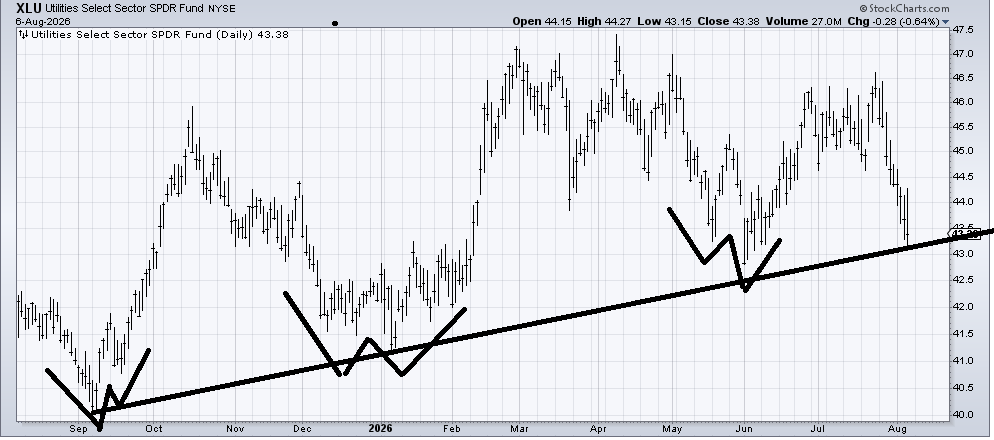
But now let’s talk about the Utes. They have been red for ten straight days, and no one seems to care. I would like someone on Financial TV to at least show a little concern! I think they are oversold enough to bounce, but I am not enthusiastic about buying them yet. We sold XLU well in July (around 46), and I am simply looking for an opportunity to get back in. I think we’ll see a W formation similar to other times, so if you want to nibble, I just want you to know I think you’re a little early.
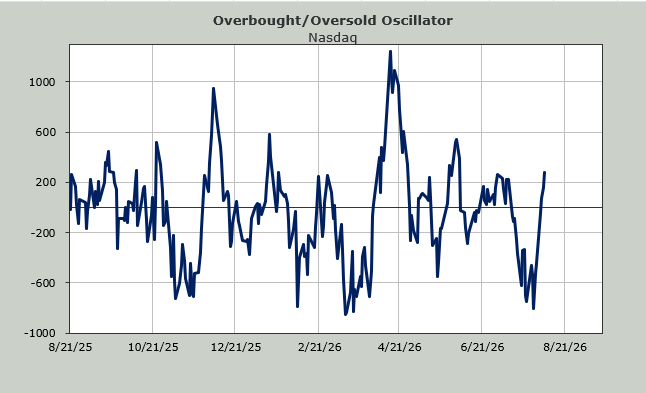
The next question is, when will Nasdaq be back to overbought? I have penciled in sometime next week for a short-term overbought condition. I am inclined to think it is more choppy than down hard, but I am willing to keep an open mind.
Finally, there is the VIX, which is now pushing down to the 15 area, the same place it was in early June and early July. The DSI for the VIX is 17, so it is possible we see the DSI sub-15 early next week, which would coordinate with an overbought condition.
There are a lot of cross-currents in the market. I do not see this as similar to the rise off the March low.
New Ideas
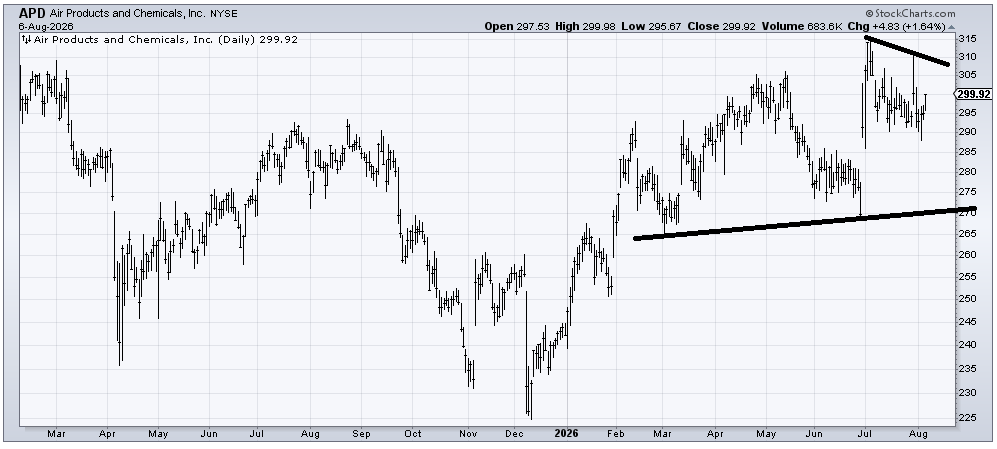
Air Products (APD) trades very thinly—you can see all the spikes with no follow-through on the chart. But it has been going sideways for a year and a half, and if it can get going, it gets much more interesting.
Today’s Indicator
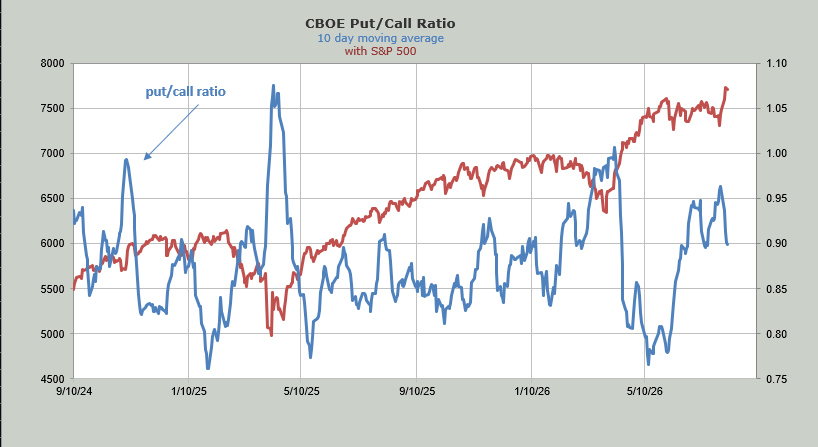
The ten-day moving average of the put/call ratio is heading down.
Q&A/Reader’s Feedback
Helene welcomes your questions about Top Stocks and her charting strategy and techniques. Please send an email directly to Helene with your questions. However, please remember that TheStreet.com Top Stocks is not intended to provide personalized investment advice. Email Helene here.
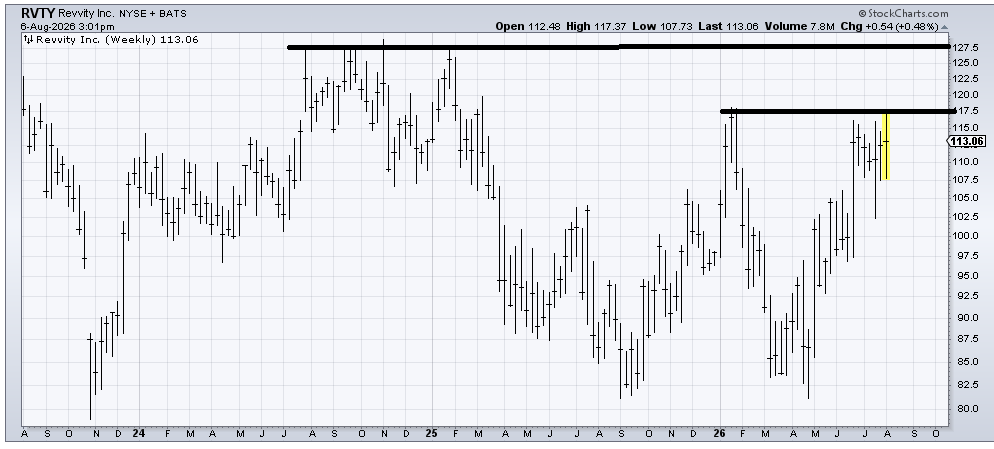
Revvity (RVTY)’s three-year, weekly chart is interesting. It is at resistance. It has resistance all the way up. I would like to see it go sideways (call it 107-117) for a few more weeks and if it can stay in that range it could breakout. So use a stop under 107.
I want to like Freeport McMoRan (FCX), but there is so much resistance at 72, and the DSI on Copper is already 77, so if it rallies from here, I won’t trust the breakout. However, if it pulls back into the 64-ish area (fills the gap) I’d probably get interested in it because it would take the DSI down and give it some room to run.
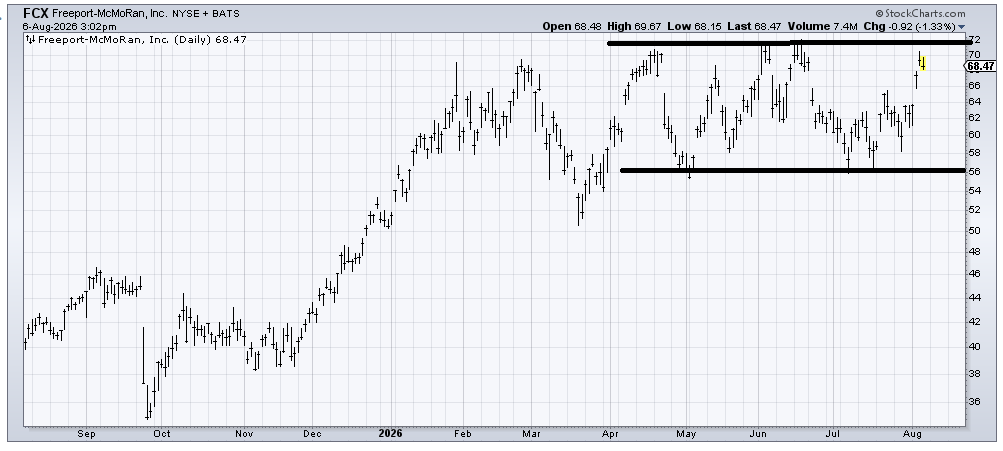
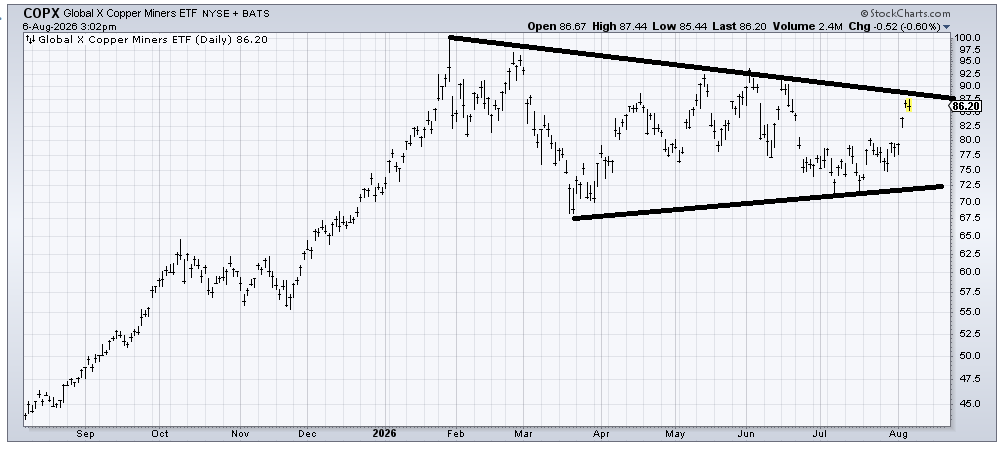
COPX (COPX) is basically a variation on the chart of FCX (above). The difference is the top line is not flat but downslanting. Again, I would want to see the DSI back off to give it a running start. Even some sideways action would do that.
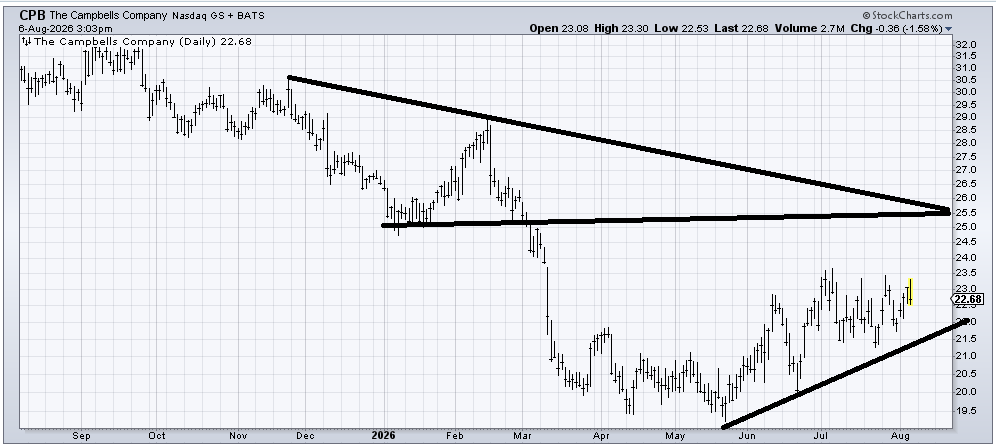
Campbells Company (that’s a name change because it used to be Campbells Pork and Beans, thus the (CPB) ticker!) is trying to bottom, but it’s way too soon to call that a base. Rather, I would say that as long as it stays over 21, it has a chance at rallying to resistance in the 25-ish area.