AMD Investors Should Watch This Key Price Level
Here's what the latest charts reveal about the popular chip stock.
You've reached your free article limit
You've read 0 of 1 free Pro articles.
Advanced Micro Devices AMD is bouncing higher Friday but let's let's try to identify the next swing trade.
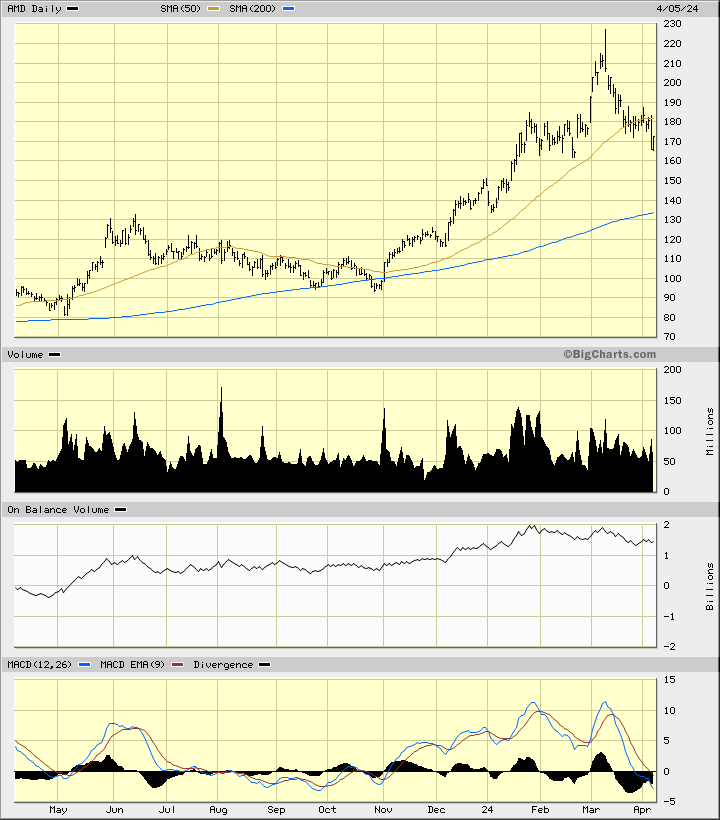
In the daily bar chart of AMD, below, I can see that the shares are still correcting the rapid rise into early March. AMD now trades below the cresting 50-day moving average line. The 200-day moving average line has a positive slope and intersects down around $133 or so.
The On-Balance-Volume (OBV) line has moved sideways to lower since late January. The Moving Average Convergence Divergence (MACD) oscillator is now below the zero line in sell territory.
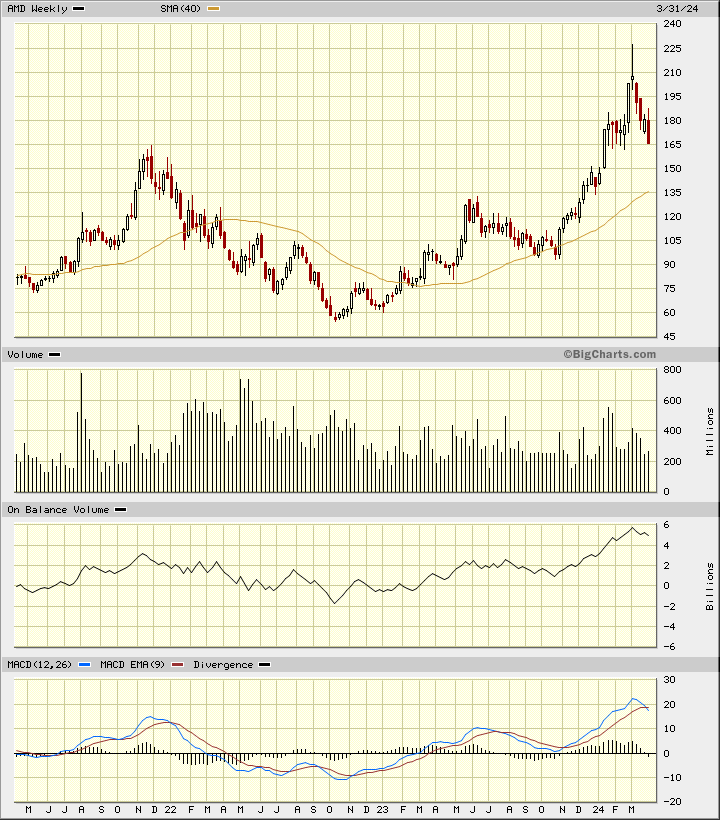
In the weekly Japanese candlestick chart of AMD, I see a mostly bearish setup. The shares have been working lower with bearish (red) candles and prices closing at the low of the week.
The 40-week moving average line is still positive but the weekly OBV line shows us a peak in early March. The MACD oscillator has crossed to the downside for a take profit sell signal.
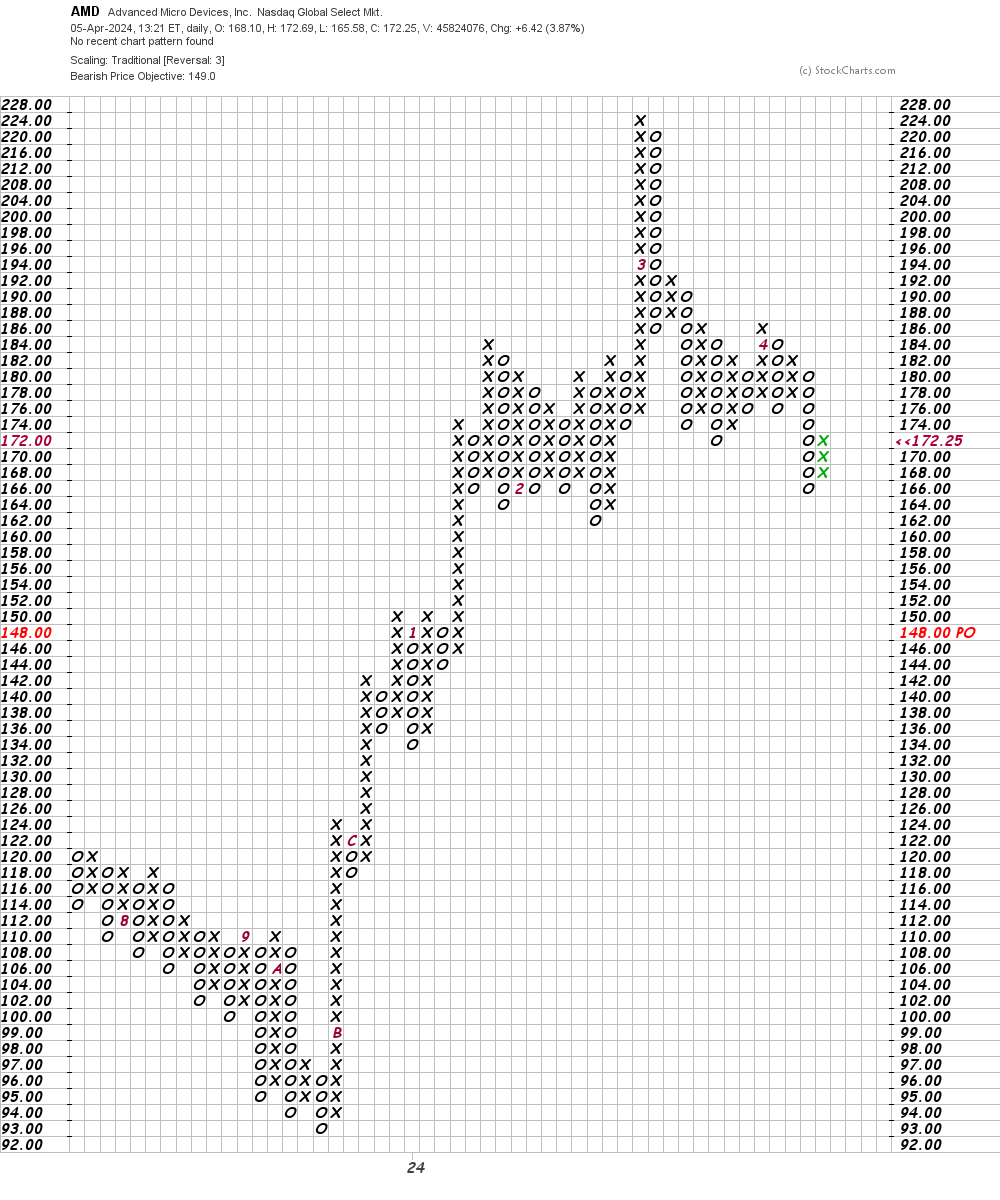
In this daily Point and Figure chart of AMD, below, I can see that the software thinks we could have a decline to the $149 area.
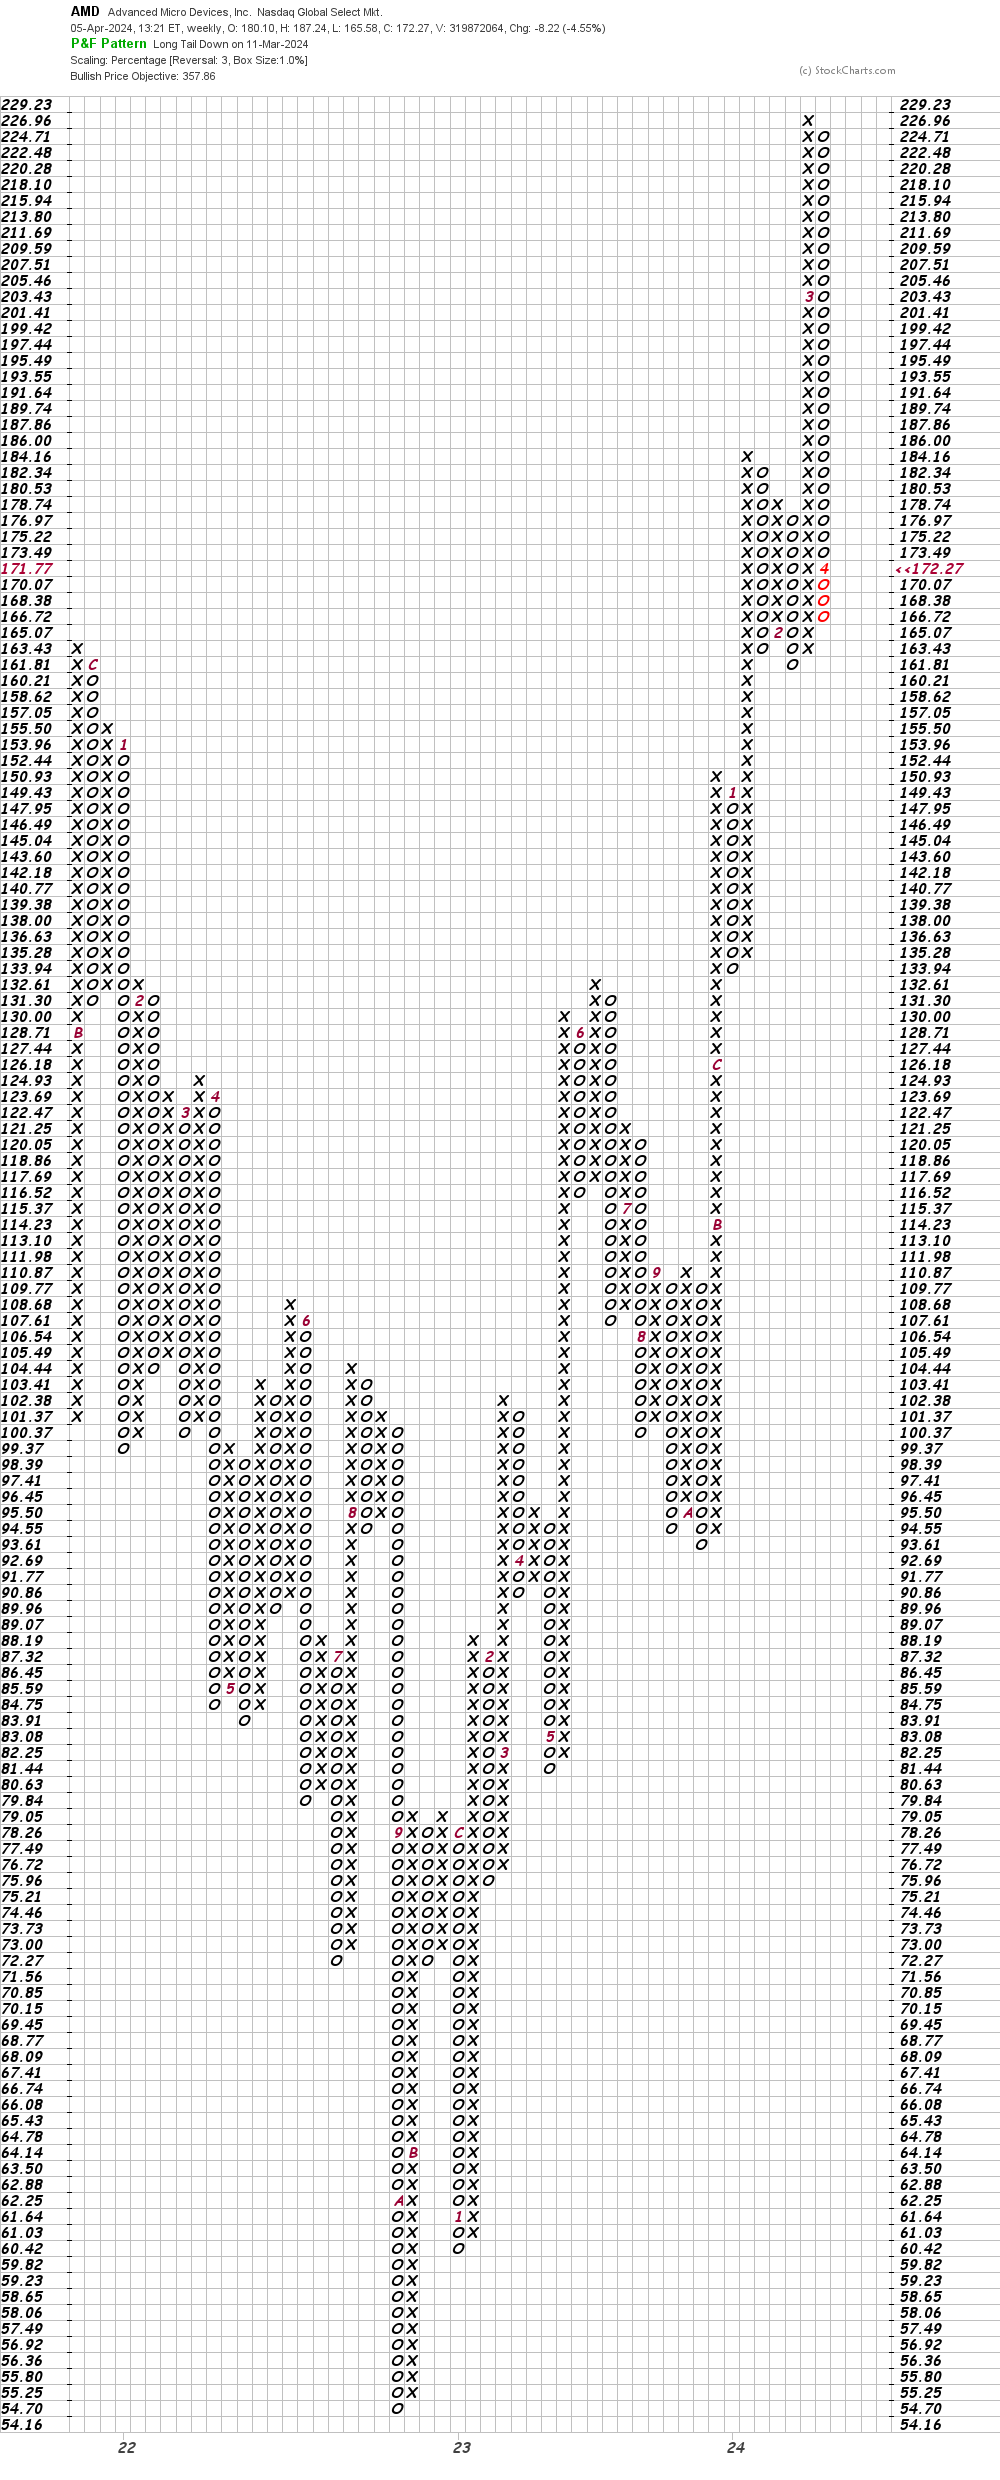
In this weekly Point and Figure chart of AMD, below, the software suggests a longer-term target in the $358 area. Big difference versus the daily chart.
Bottom-line strategy: I would avoid the long side of AMD as a break of the $160 area could precipitate further declines.
Employees of TheStreet are prohibited from trading individual securities.