Allstate May Have to Weather Some Mayhem on the Charts
Here's what gives me pause about the stock's price action.
You've reached your free article limit
You've read 0 of 1 free Pro articles.
The Allstate Corp ALL may a big presence on TV with catchy ads but the real thing I want to pay attention to is the chart action.
Let's check it out.
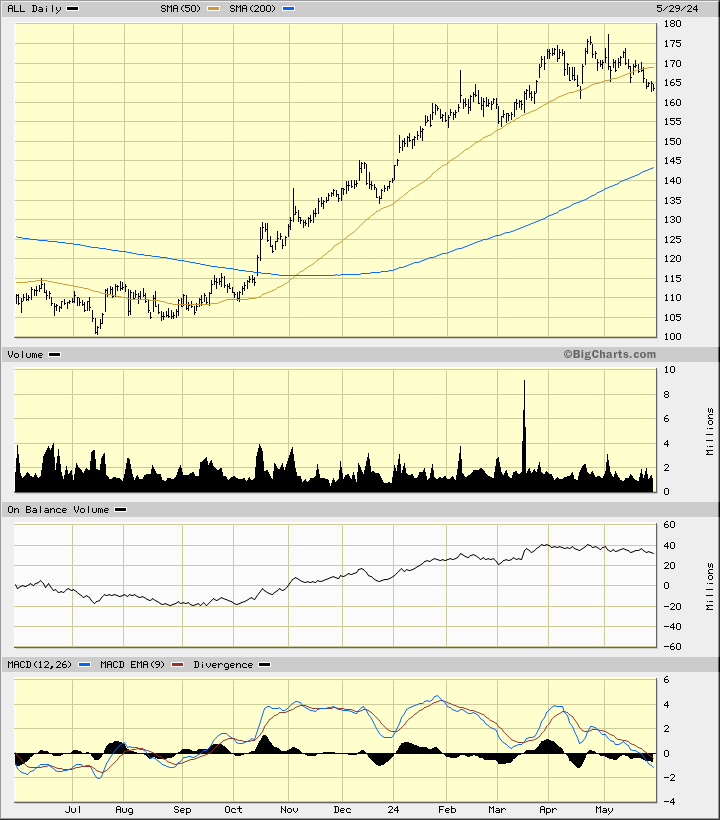
In this daily bar chart of ALL, below, I can see that prices are "rolling over" after a strong advance. ALL is now trading below the cresting 50-day moving average line. The 200-day moving average line is still rising and intersects down around $143 or so.
The On-Balance-Volume (OBV) line shows weakness since late March as traders are now more aggressive sellers. The Moving Average Convergence Divergence (MACD) oscillator has been weakening since November and is now below the zero line.
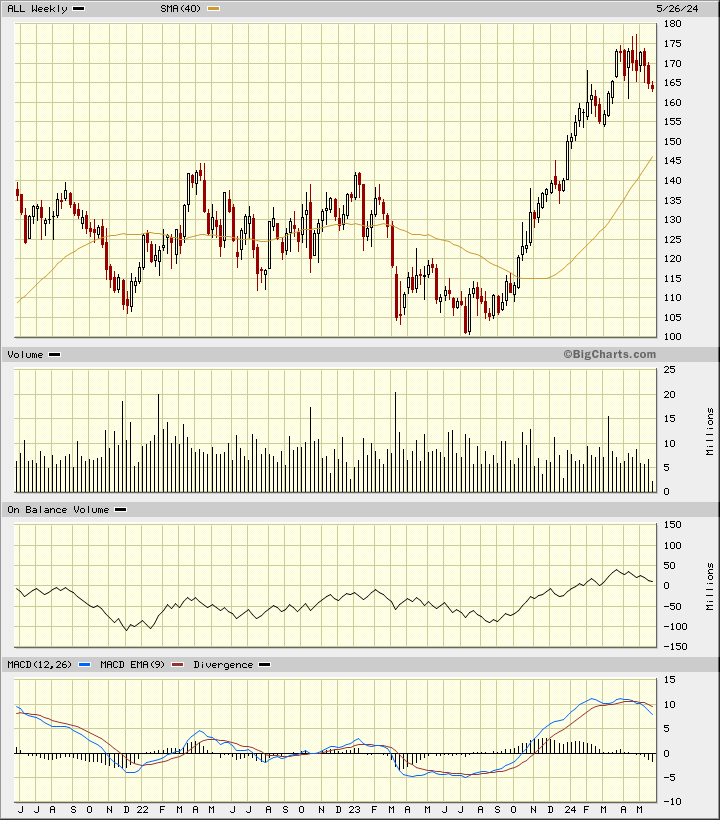
In this weekly Japanese candlestick chart of ALL, below, I see some upper shadows in April telling me that traders rejected the highs and the path of least resistance may be lower. Prices are still well above the rising 40-week moving average line but this is a lagging indicator.
The weekly OBV line is pointed lower. The MACD oscillator has crossed to the downside for a take profit sell signal.
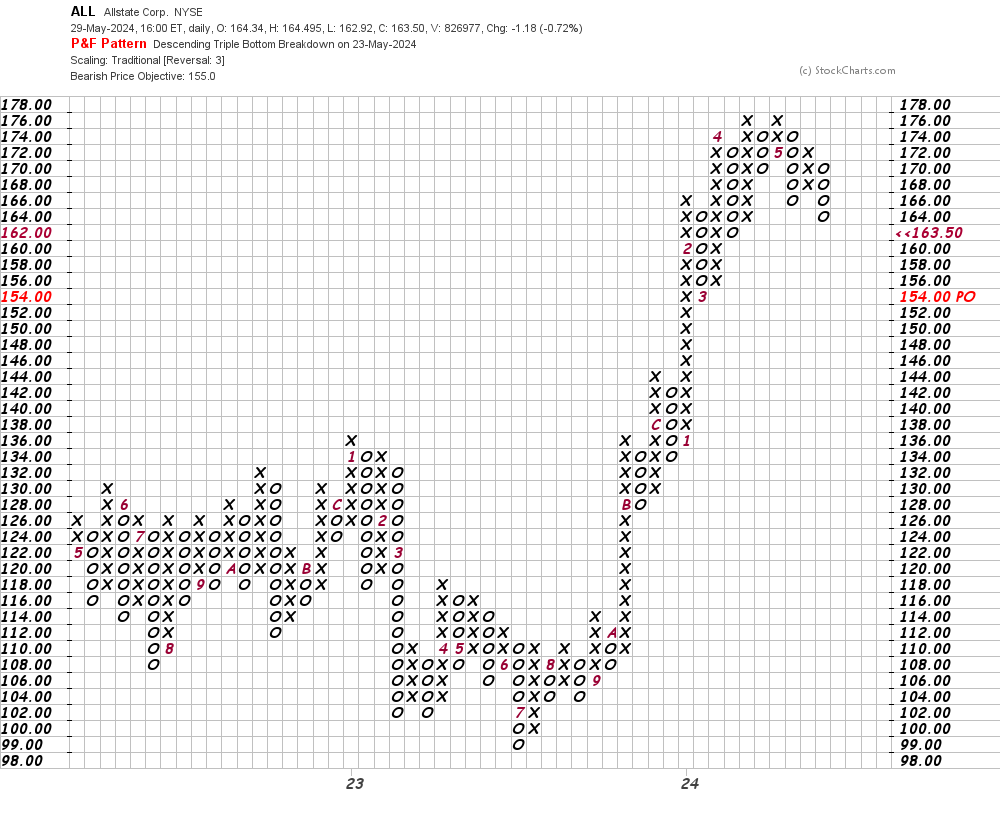
In this daily Point and Figure chart of ALL, below, I can see a downside price target in the $155 area.
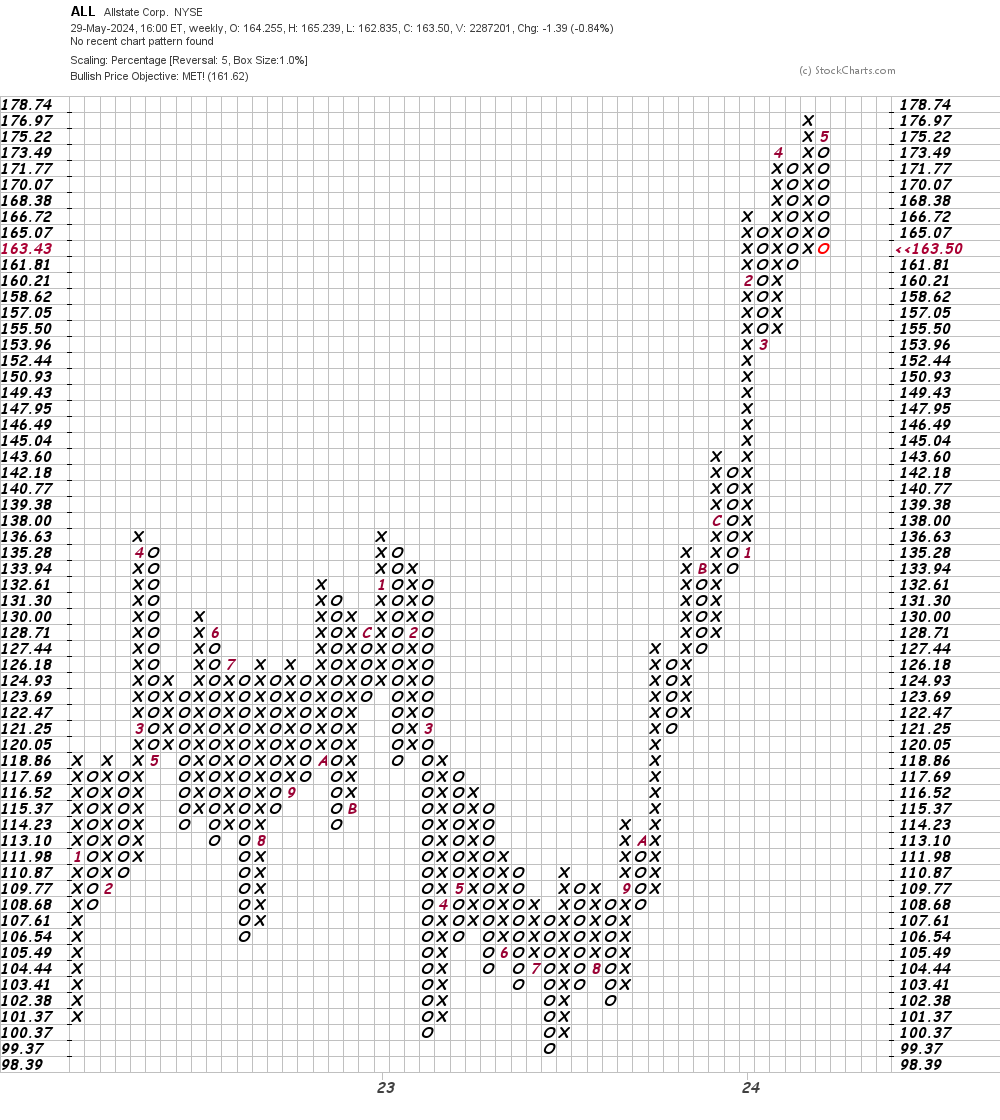
In this weekly Point and Figure chart of ALL, below, I used a five box reversal filter. Here the software tells us that prices reached an upside price target in the $161 area. Technically oriented traders may have taken reaching this price target as a reason to sell.
Bottom line strategy: Stories of destructive weather have dominated the news in recent weeks. I have no information on what ALL exposure is but it gives me pause when I look at the price action of ALL. Traders should avoid the long side of ALL for now.
Employees of TheStreet are prohibited from trading individual securities.