Caution Sign From the Banks
If you missed it, here’s a link to today’s The Morning Show on Stock Market TV. One of the “For the Bears” charts we didn’t get to is a caution sign from the banks.
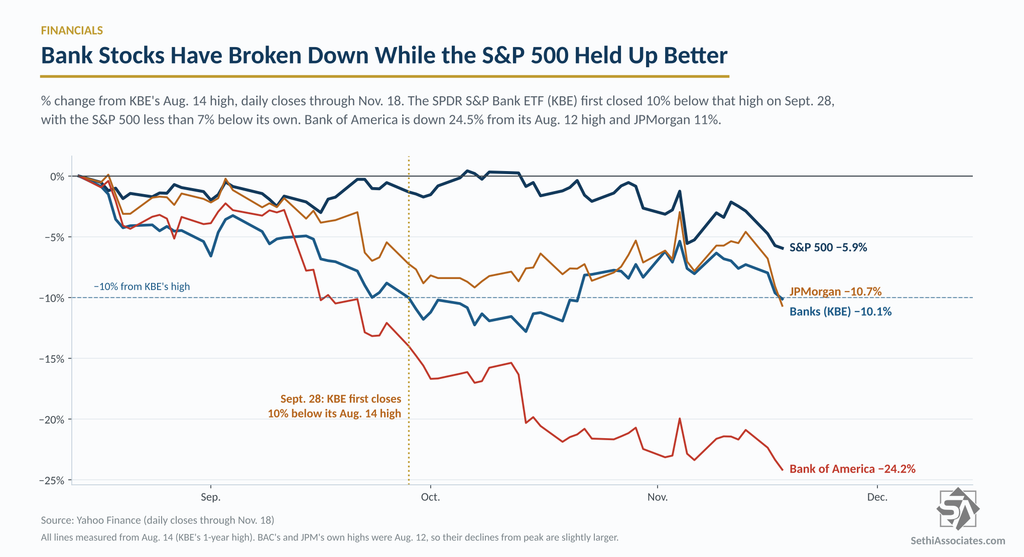
The SPDR S&P Bank ETF (KBE) first closed 10% below its 1-year high (set Aug. 14) on Sept. 28, with the S&P 500 less than 7% below its own high, and as of Wednesday’s close it was still more than 10% below.
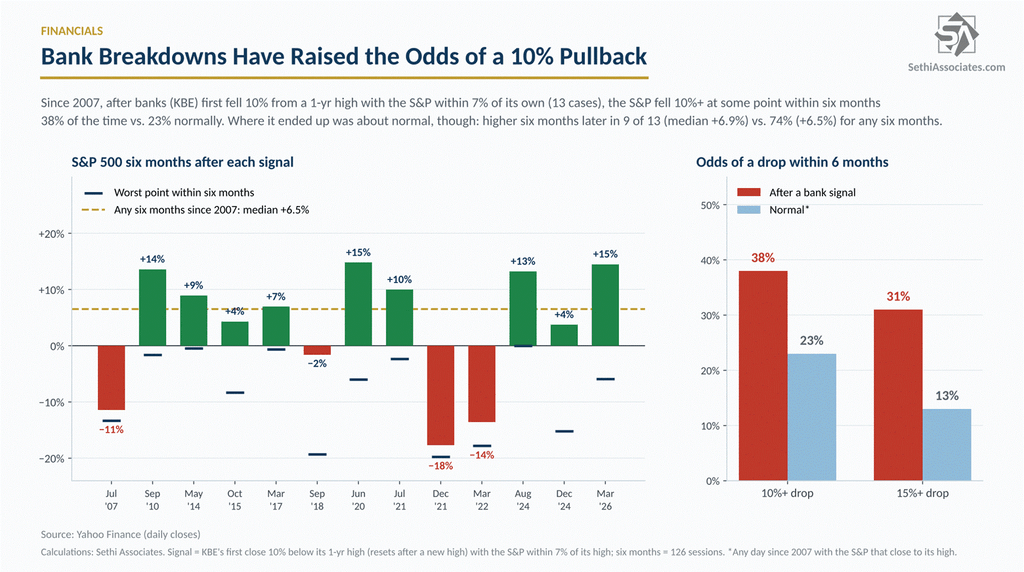
Since 2007, there have been 13 prior signals like that. “I used KBE’s first close 10% below a 1-year high, with the S&P within 7% of its own high, and reset the signal after banks make a new high.
The S&P’s path was noticeably rougher than normal afterward. It fell 10% or more at some point within six months in 5 of the 13 (38%). That compares with 23% for any day since 2007 with the index that close to its high. The odds of a 15%+ drop were 31% vs. 13%. The 10%+ drops came after the 2007, 2018, December 2021, March 2022 and December 2024 signals.
Where the S&P ended up was about normal, though. It was higher six months later in 9 of the 13, with a median gain of 6.9%. That’s roughly in line with any six-month period since 2007, which was up 74% of the time with a median of 6.5%. So it’s not a reliable sell signal, but definitely a caution sign.
Within the group, the big banks have been hit harder. As of Wednesday’s close, Bank of America (BAC) was down 24.5% from its Aug. 12 high and JPMorgan (JPM) was off 11%.
At the time of publication, Sethi was short JPM.
Conversation 0 Comments
One ongoing discussion across all days. Everyone can read; sign in to take part.
Your voice matters. Discussions are moderated for civility. Read our guidelines .
Log in to join the conversation