Weekly Roundup: What We’re Watching as Markets Get Jiggy
We locked in massive gains on two positions and added to two beaten-down holdings.
You've reached your free article limit
You've read 0 of 1 free Pro articles.
While the market got off to a rocky start in June, it recovered from that minor setback over the ensuing weeks, only to see the month-to-date gains evaporate and then some this week. Questions over potential Fed rate hikes, despite continued declines in oil prices, renewed squabbles in the Strait of Hormuz, skepticism over AI chip demand, and OpenAI contemplating moving its IPO to 2027 were all factors.
To that, we can add Apple (AAPL) announcing price increases across several product lines as it contends with the rise in memory and other key components. Efforts to prepare for the reconstitution of FTSE Russel indices after Friday’s market close likely added to things as well.
Coming into the week, we said that we would be closely watching the 50-day moving averages for the S&P 500 and the Nasdaq Composite. While the S&P 500 held its ground for most of the week, the Nasdaq Composite moved below its 50-day early in the week and was unable to rebound above it by the end of the week. We’ve seen this a few times before over the last year — in November, December and January — and the Nasdaq rebounded as supporting data points were received. The decline below the 50-day moving average was more pronounced in February and March, which we attribute to the Iran war and the climb in oil and other petrochemical prices.
Fortunately, we prudently locked in some big gains early this week before the Nasdaq’s fall, and we also used it to scoop up additional shares of two beaten-down stocks — Palantir (PLTR) and Microsoft (MSFT). As the dust settles from the FTSE Russell reconstitution and we see if the U.S.-Iran cease-fire holds over the weekend, our focus will remain on those support levels for the S&P 500 and the Nasdaq Composite.
During the week, oil prices returned to levels near where they were before the start of the war. Our view remains that if oil prices return to their late 2025 levels, or lower, May inflation data was the likely peak, and we should see improving data in the months ahead. If that comes to pass, three things are likely to happen.
First, the market will revisit its current expectation for two rate hikes in the next nine months.
Second, investors will become more comfortable with second-half 2026 EPS expectations for the S&P 500. There will be pockets of concern, where pricing pressure is due more to structural industry issues, as with the case in memory, but we’re well-positioned for that with our shares of Applied Materials (AMAT).
Third, concern over consumer spending should improve.
We have some road to go before we get there. That means paying attention to incoming data and other signals, and if need be, repositioning the Portfolio as needed.
We’ll have more to share on that in next week’s June Monthly Roundup.
Enjoy your weekend, and Saturday’s Signals Alert. See you back here, bright and early on Monday.
Catching Up on the Portfolio This Week
With both the S&P 500 and the Nasdaq Composite shedding gains this week, it should come as little surprise that the Portfolio trended lower. However, despite the declines registered in Marvell (MRVL), Palantir (PLTR), and the Friday fall in SuRo Capital (SSSS), we remain nicely ahead of the S&P 500 as we get ready to close out the first half of 2026. While the EPS All-Stars were hit along with the Nasdaq Composite this week, quarter to date, the basket it is still up 64% vs. the 12.6% gain for the S&P 500. We’ll take it.
The Portfolio’s outperformance this week was aided this week by the notable gains in Applied Materials (AMAT), Labcorp (LH), Waste Management (WM), and Welltower (WELL). One of our newer holdings, Paccar (PCAR), also chugged higher, adding to its contribution since we started the position earlier this month.
During the week, we made several trades, including locking in another round of fantastic gains on shares of Applied Materials and Marvell. Part of our rationale for making those trades was to lock in gains, but also to free up some cash ahead of the upcoming reconstitution for the EPS All-Stars basket, which will begin on June 30 and be completed early on July 1. As a reminder, with that reconstitution, we will be resetting the starting Q2 2026 position size for each position in the new basket to 0.75% of the Portfolio’s assets.
On Thursday, we took advantage of the sharp pullback in Palantir shares and the larger software sector to pick up additional shares for the Portfolio. As part of that move, we outlined the conditions we’re watching and what could lead us to add further to the position. On Friday, we made a similar move with Microsoft (MSFT).
The net result of those moves left the Portfolio’s cash position near 7% of its assets ahead of next week’s EPS All-Stars reconstitution. Friday’s decline in SuRo Capital shares lands them on our shopping list, and the same goes for other positions that have slipped past their respective pick-up points. Because capital is finite and we have that EPS All-Stars reconstitution ahead of us, any moves we make will be ones that balance potential upside against potential downside risk. In other words, the odds of us adding to every one of those positions is slim, but we’ll concentrate on the biggest potential bang for our Portfolio bucks.
Now let’s see what others on Wall Street had to say about the Portfolio’s holdings this week:
Monday: Marvell shared joined the S&P 500. Wells Fargo hiked its Applied Materials price target to $715 from $520. KGI Securities downgraded Apple (AAPL) shares to Hold from Outperform but maintained its $315 target.
Tuesday: Citi increased its price target for Morgan Stanley (MS) to $220 from $194 and for Bank of America (BAC) to $66 from $62. BofA lifted its Applied Materials target to $720 from $540 and took its Marvell target to $365 from $240. Alphabet (GOOGL) will join the Dow Jones Industrial Average before the market opens on June 29.
Wednesday: Stifel increased its Marvell target to $350 from $321, while Truist boosted its American Express (AXP) target to $375 from $360.
Thursday: KeyBanc reset its price target for United Rentals (URI) $100 higher at $1,250, while BofA took its target to $1,195 from $1,020.
Friday: Truist bumped up its BofA target to $64 from $61. Applied Materials caught two price target increases, one from Wells Fargo to $740 and the other from B. Riley to $790 from $550.
Key Global Economic Readings
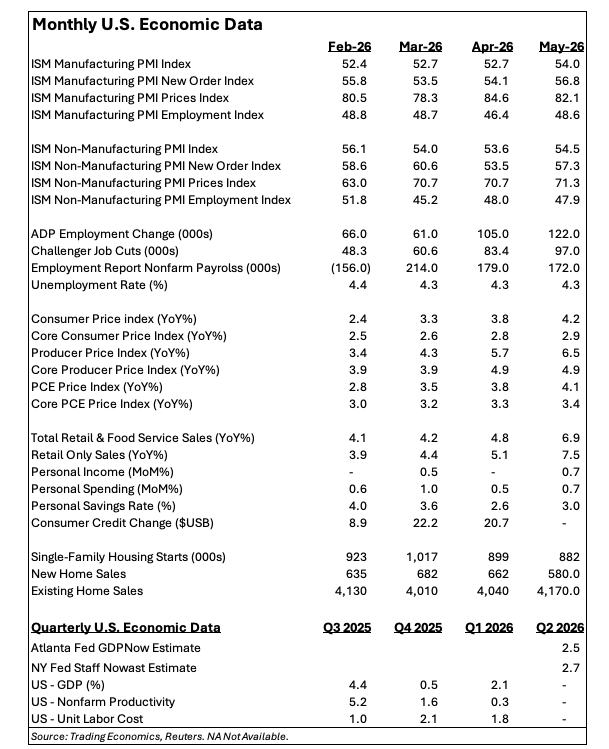
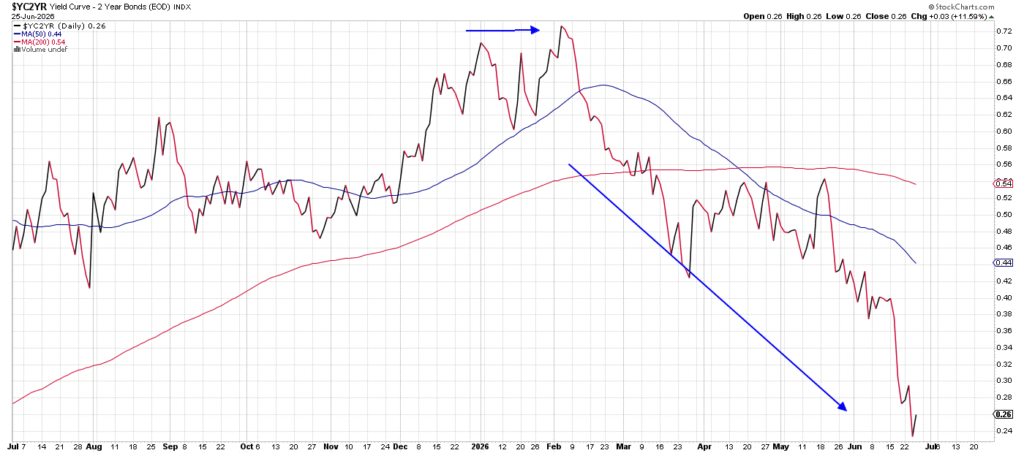
Chart of the Week: Two-Year Bond Yields
We always keep one eye on the bond market to give us clues about the economy and, thus, how the stock market may perform in the future. Though we do not directly invest the Portfolio in fixed income, we must look at the term structure of rates (yield curve) from time to time to see how these investors’ view inflation, growth, and other important economic elements.
One of the best gauges for looking at future Federal Reserve monetary policy and economic growth is to compare two U.S Treasury yields, the 2-year versus the 10-year. We call that the 2/10 spread, a widely followed comparison that produces some very accurate results when interpreted correctly.
The 2-year yield makes sense to analyze; it heavily influences Fed policy and short-term rate expectations. One can look at the 2-year yield and project where monetary policy will be in that period, with a good filter for short-term noise (the 6-month and 1-year are very noisy charts and can mislead the viewer).
Long-term bond investors pay close attention to the 10-year as it drives the mortgage market and gives a good estimate of the health of the long-term economy. Mortgage rates are mostly tied to the 10-year, as homeowners in general stay in a mortgage for about 10-12 years before moving or selling or refinancing.
When analyzing the 2/10 spread (curve), there are three potential outcomes: Flattening, steepening or neutral. A flattening of the spread signals the market is seeing weaker growth ahead, and perhaps dovish Fed policy is nearer than anyone thinks. A steepening yield curve, or to use bond market lingo a “steepener,” says that investors are attracted to risk and willing to buy higher yields, expecting strong growth and little inflation.
When the curve is neutral, there is not much to discern other than that a move in either direction is imminent. When the curve inverts (gets below zero on the chart), there is a high risk of recession, but those calls have been loud over the past 10 years (several times) but never came to pass.
So, to the chart. We can see below the 2/10 spread was very steep early in the year, at 0.72, but has declined significantly. The 2/10 spread is now at 0.25, the culprit being the 2-year for this very reason (it has been rising at a faster rate than the 10-year, and the difference is narrowing fast).
What does it all mean? Fixed-income players are getting worried about rate hikes coming soon, with the rising 2-year (nearly 4.15%), while long-term investors are worried about growth slowing down considerably (10-year is at 4.39%).
The analysis? Sharp slowdown coming and no relief coming from the Fed. And if unemployment starts to rise, we could be faced with the difficult challenges of stagflation.
Other charts we shared with you this week were:
Monday, June 22: S&P 500 – Can the Index Keep It Going?
Monday, June 22: United Rentals (URI) – Don’t Fall Asleep on United Rentals
Tuesday, June 23: TJX (TJX) – TJX Heads into Summer with Wind at Its Back
Wednesday, June 24: Meta (META) – Meta’s Technicals Continue to Erode
Thursday, June 25: Welltower (WELL) – Welltower Quietly Makes a New High
The Week Ahead
We have another compressed trading week coming at us, and not only will it be jam-packed with June economic data, but it also closes out the current quarter and kicks off Q3 2026. It’s going to be a busy week. On top of that, we’ll also have the June Monthly Roundup to share with you once we close the book on Q2 2026 and before Wall Street observes the July 4th holiday on Friday, July 3.
Across the June data that will be published next week, our focus will remain on the speed of the economy, comparing inflation figures to those for May, and the pace of job creation compared to recent months. We will also look to see what the impact of falling gas prices translates into for the June Consumer Confidence reading.
With our position in Paccar (PCAR) in mind, July 1 brings the next truck tonnage data point from the U.S. Bureau of Transportation Statistics. Around the time we get the next truck tonnage numbers, we should also get the Flash June truck order data from ACT Research.
Here’s a closer look at the economic data coming at us next week:
U.S.
Monday, June 29
Dallas Fed Manufacturing PMI – June (10:30 AM ET)
Tuesday, June 30
S&P Case-Shiller Home Price Index – April (9:00 AM ET)
FHFA Housing Price Index – April (9:00 AM ET)
Chicago PMI – June (9:00 AM ET)
Jolts Job Openings & Quits – May (10:00 AM ET)
Consumer Confidence – June (10:00 AM ET)
Wednesday, July 1
Challenger Job Cuts – June (5:30 AM ET)
MBA Mortgage Applications Index – Weekly (7:00 AM ET)
ADP Employment Change Report – Weekly (8:15 AM ET)
S&P Final Manufacturing PMI – June (9:45 AM ET)
ISM Manufacturing Index – June (10:00 AM ET)
EIA Crude Oil Inventories – Weekly (10:30 AM ET)
Thursday, June 2
Initial & Continuing Jobless Claims – Weekly (8:30 AM ET)
Employment Report – June (8:30 AM ET)
Factory Orders – May (10:00 AM ET)
EIA Natural Gas Inventories – Weekly (10:30 AM ET)
International
Monday, June 29
Japan: Retail Sales, Housing Starts – May
Eurozone: Loans to Companies and Households – May
UK: Bank of England Consumer Credit – May
Eurozone: Economic Sentiment, Consumer Confidence – June
Tuesday, June 30
Japan: Industrial Production (Prelim.) – May
China: NBS Manufacturing and Non-Manufacturing PMI – June
UK: Business Investment – Q1 2026
Wednesday, July 1
Japan: Tankan Large Manufacturers Index – Q2 2026
Japan: S&P Global Manufacturing PMI – June
China: RatingDog Manufacturing PMI – June
Eurozone: S&P Global Manufacturing PMI, Flash Inflation Rate – June
UK: S&P Global Manufacturing PMI – June
Thursday, July 2
Eurozone: Unemployment Rate – May
Friday, June 3
Japan: S&P Global Services PMI – June
China: RatingDog Services PMI – June
Eurozone: S&P Global Services PMI – June
UK: S&P Global Services PMI – June
We have a handful of earnings reports out next week, and, in our view, the market will focus on results and guidance from Nike (NKE) front and center. Its comments on demand, the consumer, input costs, pricing, tariffs, and the dollar will be what we will be most interested in.
The next data point we’ll be watching for the Portfolio’s position in Boeing (BA) is the company’s June 2026 delivery figure. Odds are it will be published after the July 4th holiday weekend, but we’ll keep our eyes peeled for it as we approach the holiday weekend, should it come out sooner than expected.
As we begin July, we will also have our radar up for earnings preannouncements, both good and bad, as we get ready for the Q2 2026 earnings season. Based on the calendar of known earnings reporting data so far, that looks to begin in force on July 14.
Here’s a closer look at the earnings reports coming at us next week:
Monday, June 29
Close: AeroVironment (AVAV)
Tuesday, June 30
Close: Constellation Brands (STZ), Nike (NKE), Progress Software (PRGS)
Wednesday, July 1
Open: FactSet (FDS), General Mills (GIS), MSC Industrial (MSCI)
Close: Greenbrier (GBX)
Thursday, July 2
Open: Lindsay Corp. (LNN)
Portfolio Investor Resource Guide
Economic Data: Here’s a List of Links to the Key Economic Data We Closely Watch
Investing Terminology: 16 Key Terms Club Members Should Know
10-Ks: Want to Know About a Stock? Read the Company’s Reports
10-Qs: Unlock the Numbers and Key Information Behind Your Stock With the 10-Q
Income Statement: Our Cheat Sheet to Understanding This Financial Document
Balance Sheet, Cash Flow Statements, and Dividends: How to Know If a Company Is Off-Kilter? Read Its Balance Sheet
Valuation Metrics: Everyone Wants a Value. Here’s How Investors Can Find
Thematic Investing 101 Webinar
Like the Benefits of ETFs? Let’s Talk About Models
The Portfolio Ratings System
1 – Buy Now (BN): Stocks that look compelling to buy right now.
2 – Stockpile (SP): Positions we would add to on pullbacks or a successful test of technical support levels.
3 – Holding Pattern (HP): Stocks we are holding as we wait for a fresh catalyst to make our next move.
4 – Sell (S): Positions we intend to exit.
