Chart of the Day: Welltower Quietly Makes a New High
Good relative strength and volume on this name means more upside could be in store.
You've reached your free article limit
You've read 0 of 1 free Pro articles.
A nice, slow move upward on some volume is indicative of a stock showing good strength when the market is higher, but also limits those occasional pullbacks to minimal losses. Welltower (WELL) just made a new high this week, carried higher by strong technical signals like the MACD and stochastics.
No question the chart shows bullish qualities now, but is not reflecting it just yet in the candles. Notice on the GoNoGo candle chart the price just flipped from bearish to neutral. That won’t stand for too much longer as the bulls have now wrested control of the trend.
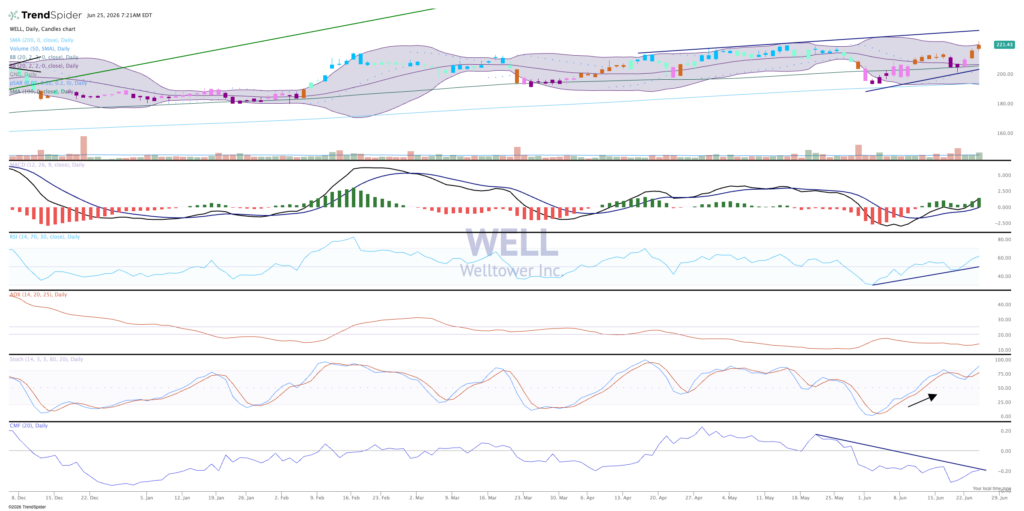
The momentum indicators are bullish, with a continued buy signal on the MACD, positive trending relative strength that is not overbought yet, and momentum showing from the stochastics (pane 5). The only fly in the ointment might be money flow, but this stock is not a “streaky” name you often see in the tech sector.
With the recent push above the old highs at $220 we could see Welltower now break out to the $250 level. The series of higher highs, higher lows recently is quite bullish.
We like Welltower in TheStreet Pro Portfolio and rate it a Two, or “stockpile on pullbacks.”
More Pro Portfolio:
- Locking in Big Gains on Two Positions
- Tracking 21 Signals Across 10 of Our Investing Themes
- Weekly Roundup: Peace Deal, Warsh Arrives, and the Portfolio Moves Ahead
At the time of publication, TheStreet Pro Portfolio was long WELL.
