Weekly Roundup: Planting Seeds for Further Growth
As the portfolio closed out a successful first quarter this week, we locked in some hefty gains on two positions.
You've reached your free article limit
You've read 0 of 1 free Pro articles.
Thursday we closed the book on the March quarter, and it was one of the best starts to a new year in some time, with the S&P 500 delivering a 10.2% gain and the Nasdaq Composite climbing 9.1%.
Comparing that performance against the equal-weighted S&P 500, which returned 7.4% for the period, we can deduce the continued impact of AI-related stocks. We participated in that driving force through our positions in Alphabet (GOOGL) and Microsoft MSFT as well as a well-timed addition of Nvidia NVDA to the portfolio. Despite our cash levels, something the S&P 500 or the Nasdaq Composite do not have, the portfolio finished the quarter up a respectable 7.9%.
If one simply looked at that percentage gain, they might miss the significant quarterly performances logged by our Applied Materials AMAT, United Rentals URI, Axon Enterprise AXON, and Vulcan Materials VMC, all four of which rose more than 20%. Behind those topping the portfolio leaderboard, another 10 of our holdings delivered double-digit gains.
While those stocks ran hard during the quarter, and we see further upside ahead because of the economy’s strength, stimulus spending across infrastructure, the CHIPS Act, public safety spending, and AI investments, we’ve also planted seeds that should start to bear fruit in the coming quarters.
Our shares of Morgan Stanley MS lagged during the first quarter, but the re-opening of the IPO market as well as the M&A activity are poised to become tailwinds for the company, and also Bank of America’s BAC investment banking business. The start of that led us to boost our price targets for both stocks this week, and the strength of the IPO market could lead us to make similar adjustments in the coming weeks.
Lockheed Martin LMT rebounded late in the quarter, but the real catalyst for LMT will be the resumption of F-35 deliveries, which is poised to start late in Q2 2024 or early Q3 2024. Meanwhile, coming AI-on-device upgrade cycle for PCs, smartphones, tablets, and other devices should be a catalyst not only for shares of Apple AAPL which were one of the worst performers during the March quarter, but also for our Qualcomm QCOM and Universal Display OLED positions.
With regard to Universal, the continued adoption of organic light-emitting diode displays across a wider array of devices should drive favorable volumes and earnings as we move through the year. Case in point, Apple is expected to begin shipping new iPad Pro models with organic light-emitting diode displays in May. We see the AI-on-device upgrade cycle turbocharging data creation and consumption, pressuring networks and carrier infrastructure, which is why we recently boosted our rating on Marvell Technology MRVL shares to a One.
While we are certainly pleased with the portfolio’s first-quarter performance, we will continue to ferret out new opportunities for the portfolio as well as the bullpen. Our focus remains on buying shares of companies with superior earnings prospects at favorable risk-to-reward entry points, but the combination of the market’s December and March quarter moves has stretched the market’s valuation and those of portfolio candidates as well.
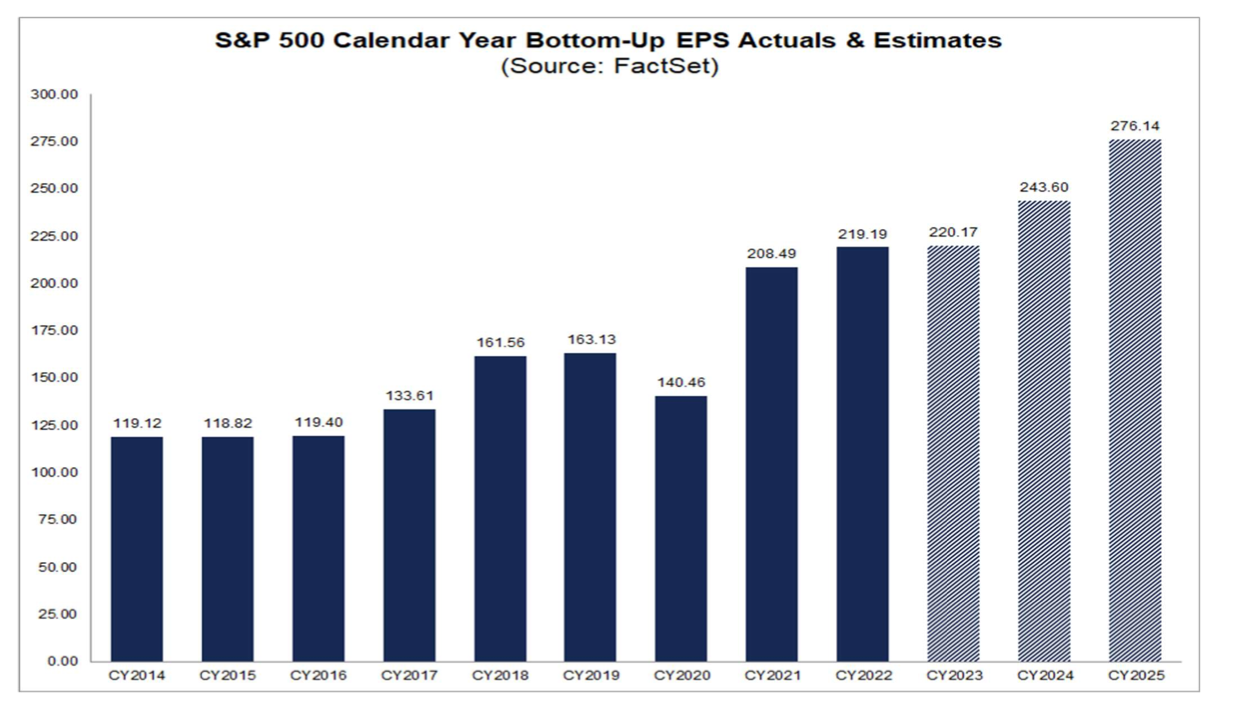
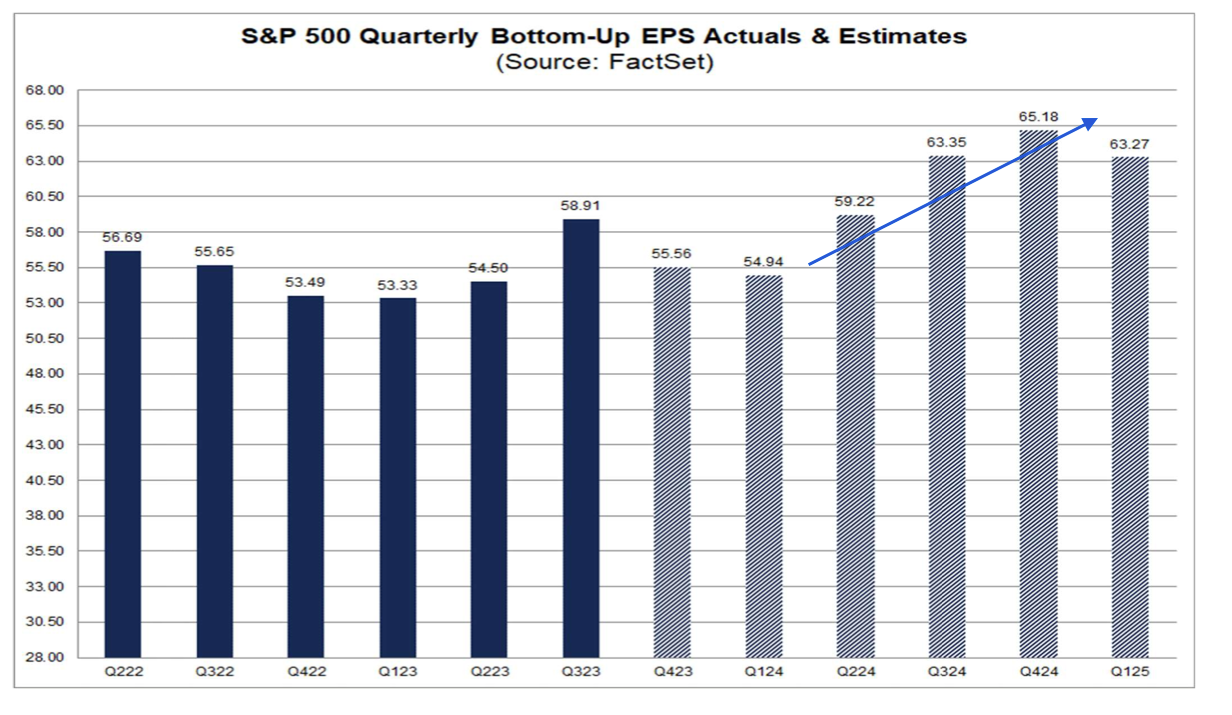
Exiting March’s last trading day, the S&P 500’s P/E multiple on consensus 2024 EPS estimates was 21.6x, bumping up against levels associated with the market’s peak P/E multiples over the last few years and well above the 24-year average peak P/E multiple of 19.5x. In the above chart, the consensus 2024 EPS is expected to grow 10.6% this year, and as of now accelerate further in 2025. Looking at the below chart, however, earnings growth for the S&P 500 isn’t expected to rebound with March-quarter earnings but lift off when the June quarter is reported several months from now.
Given current valuation levels, while we could see additional multiple expansion, the driver for further sustained gains by the market will hinge on earnings growth. The economic backdrop is favorable, but we will need to see corporate guidance in the coming weeks live up to, if not surpass the expected ramp in S&P 500 earnings for Q2 2024. The prospect of fewer than previously expected rate cuts this year is a potential thorn in those EPS forecasts. New order data contained in next week’s March PMI reports will shed light on the economy’s strength heading into Q2 2024.
Because of the market’s current multiple, if the aggregate earnings growth outlook is softer than expected, the ensuing re-think could fuel a pullback. That potential has us watching the uptrend lines identified by Helene Meisler and Bob Lang, especially the lower support level. If the S&P 500 broke through that level, we would likely see a larger move lower than the 2% decline to that support level.
We know this is a potentially unpopular thought, but the truth is we would welcome such a reset as it would allow us to put our cash to work, picking up more shares of companies on our shopping list and potentially a new position or two. At the same time, we will continue to watch RSI levels for the S&P 500 and Nasdaq Composite and other factors to gauge when to close out our inverse ETF positions. As earnings expectations are reset, including those for our holdings, should we see major negative revisions and our investment rationale become challenged, we will make adjustments as warranted.
Catching Up on the AAP Portfolio This Week
Early in the week, we locked in some of hefty gains registered in Axon Enterprise, and as we closed out the quarter, we did the same with our Energy Select Sector SPDR Fund XLE shares. We made no additions to the portfolio this week, which means as we enter the new quarter, the portfolio’s cash position is around 17.6% of its assets.
We want to be judicious with our capital, especially because the continued melt-up has the market knocking on the door of recent peak P/E multiples, limiting the number of viable opportunities near term. We intend to put that cash to work selectively, continuing to use either pullbacks that offer more favorable risk-to-reward entry points or positive catalysts that support our rationale for owning the shares and improve their earnings prospects.
Stocks on our shopping list include more shares of Universal Display, Nvidia, Waste Management WM, and some others including one or two in the bullpen.
This Week's Portfolio Videos and Podcasts
We cover a lot of ground during the week in our Daily Rundowns and the Portfolio Podcast. If you happened to miss one or more of them, here are some helpful links:
Monday, March 25: Our Game Plan for the Shortened Trading Week
Wednesday, March 27: 2 Big Reasons We've Got Friday on Our Minds
Thursday, March 28: Let's Recap a Strong First Quarter for the Portfolio
Key Global Economic Readings
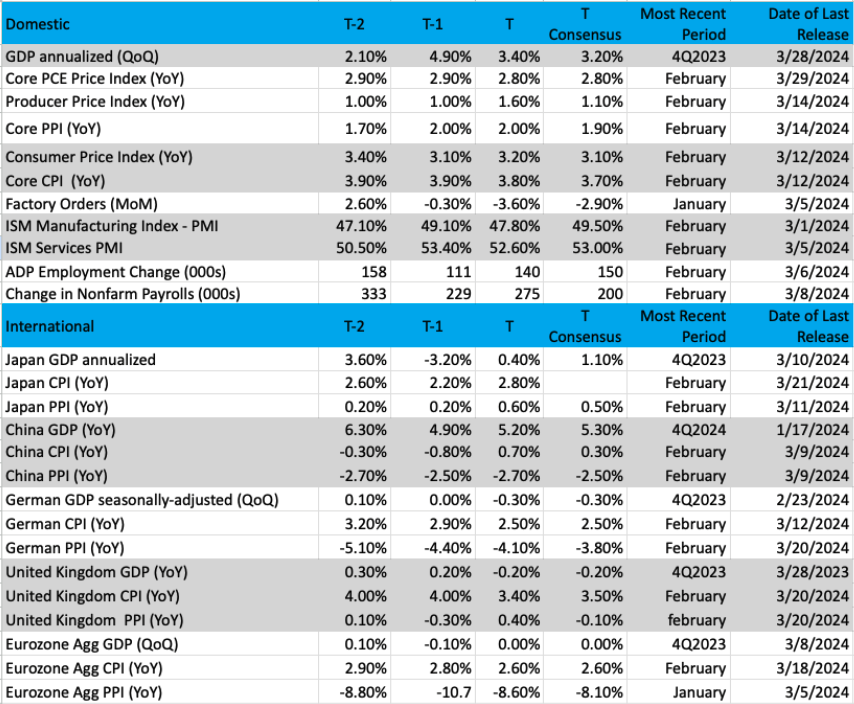
(Note: T is the most recent period, T-1 is the prior period's reading and T-2 is two periods back, the intent being to illustrate any trends)
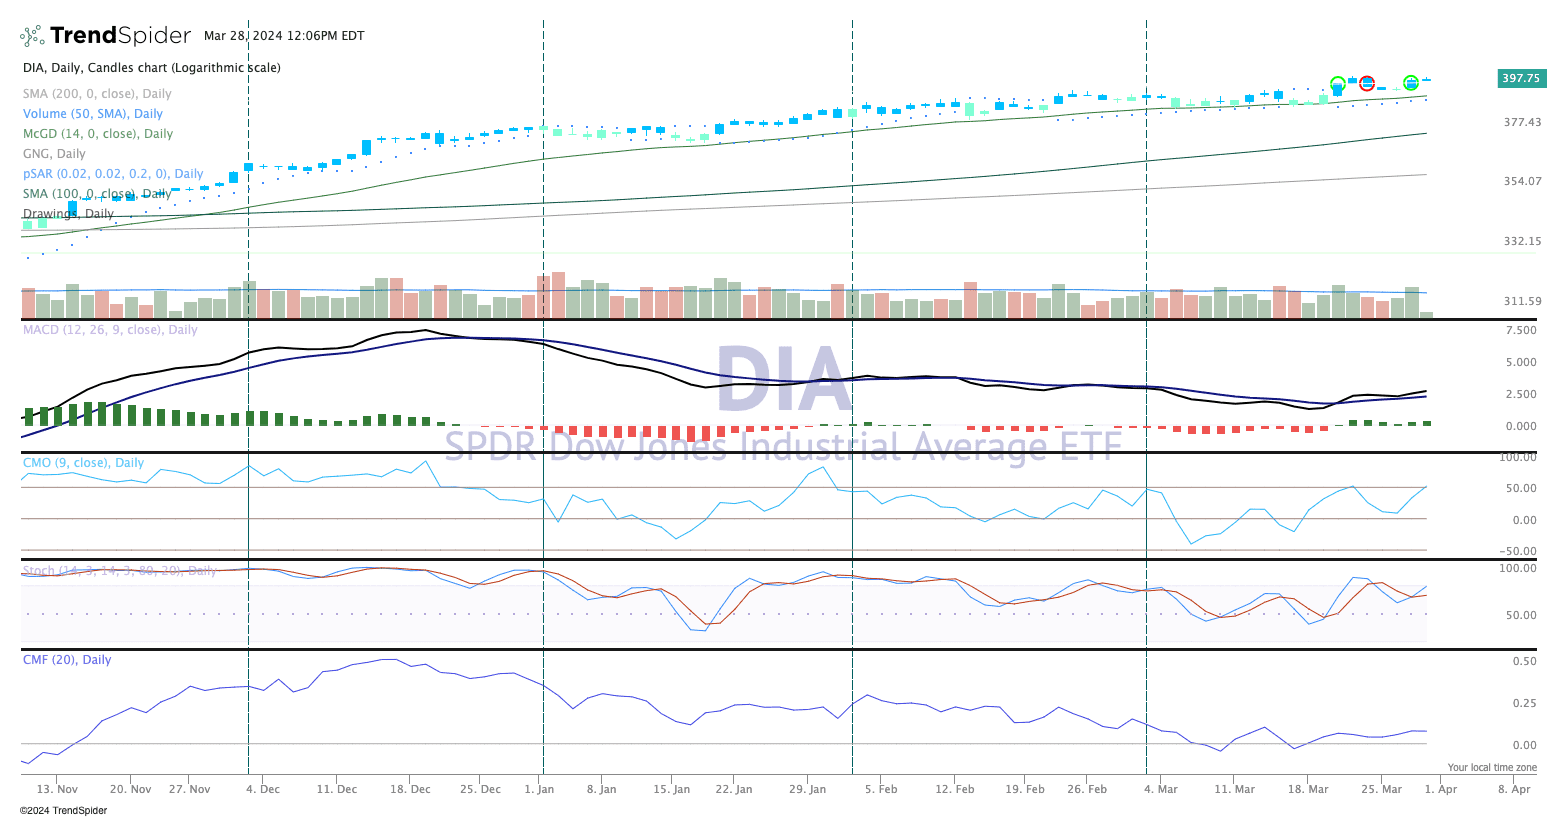
Chart of the Week: Dow Jones Industrial Average
Over the past month, thee has been a pretty strong trend for the Dow Industrial Average, represented here by the SPDR Dow Jones Industrial Average ETF Trust DIA. With a gain of more than 2% in March the DIA is up a very solid 5.5% so far in 2024. That is just about 40% of the total gained in 2023, which was a very strong year for the index.
With some new components in the index like Amazon AMZN, part of TheStreet Pro portfolio, the DIA is showing some very good chart strength. The portfolio owns four DIA components. As we move into the next earnings season in April many of the Dow Industrial companies will be reporting their first-quarter earnings. Perhaps the bar for these companies has been lowered (which often happens by the company or analysts) and there will be some positive movement.
The Dow Industrial Average is bumping right up against 40,000, a magical milestone that some would have seen as unattainable just a few years ago. But we are there now and as the economy continues to hum along these high-quality companies should continue to move upward.
The chart below for DIA shows a very strong trend of higher highs and higher lows. The candles are either blue or teal, which reflects a strong bullish condition. Moving Average Convergence Divergence (MACD) remains on a buy signal, though, money flow (bottom pane) is steady and bullish, and stochastic (pane 4) has now turned up for a buy signal. That is important to keep the momentum moving.
When looking at this daily chart, what’s not to like? With $400 in its sights, the DIA looks to have more upside on the road ahead.
For a larger view of this chart please click here.
https://share.trendspider.com/chart/DIA/4669bffp8t
Other charts we shared with you this week were:
Monday, March 25: S&P 500 - Channel Narrows, But Trend Is in Place
Monday, March 25: Bank of America (BAC) - Bank of America's Uptrend Is Very Bullish
Tuesday, March 26: Nvidia (NVDA) - Back Up the Truck if Nvidia Corrects
Wednesday, March 27: Lab Corp. (LH) - Laboratory Corp Muscles Its Way Through Resistance
Thursday, March 28: Welltower (WELL) - Welltower Is Ready to Break to the Upside
The Coming Week
How we begin April, and the next quarter, will be influenced by how the market reacts to Friday’s February PCE Price Index and comments from Fed Chair Jerome Powell late Friday morning. While the February headline and core PCE data were in line with the market forecast, a closer look at the data in recent months shows those inflation metrics have stalled out over the last few months.
After reviewing the February PCE report, we agree with Fed Governor Waller’s comments from earlier this week that there is no rush for the Fed to begin cutting interest rates based on the totality of the data of late. The February PCE data is helpful, but we do not think the central bank will hang its hat on any one report. Instead, it will want to see multiple measures of inflation moving together toward its 2% target, not the conflicting views found across the February data. To us, this means we should expect Powell to reiterate the need to see more good data should he discuss the economy and monetary policy.
While those items will set the pre-market tone for the start of trading on Monday, the plate of economic data we will be served next week will give us a far better sense of the economy’s speed during the March quarter and inflation. Following the third estimate of December quarter GDP at 3.4%, the March quarter’s speed will be slower, no question, but at 2% or better it will be on par with H1 2023 even though monetary policy is, as even the Fed is calling it, restrictive. Tucked inside the March PMI data, new order data will be an indication of the economic footing for Q2 2024.
Similarly, the insights on inflation and job creation to come from those reports will also be helpful ahead of the March Employment Report later in the week and the soon-to-be-upon published March CPI and PPI reports. Because the data found in those January and February PMI reports were good indications for what we’ve seen in the January and February CPI and PPI reports, it stands to reason next week’s data may provide an important signal when it comes to rate-cut timing.
Ahead of reviewing those coming insights, we still think the timing for the first rate cut will slip into H2 2024, and the probability of less than the three rate cuts shown in the Fed’s latest set of economic projections is rising.
In addition to those reports, next week we’ll also get the February Construction Spending report, which we will be scrutinizing because of our holdings in United Rentals and Vulcan Materials. With the February Housing Starts report already published, the meat of this forthcoming report that will interest us will be what is found for non-residential construction. Coming off that report, we will revisit our current price targets for both of those portfolio positions.
Here's a closer look at the economic data coming at us next week:
U.S.
Monday, April 1
● S&P Global Final Manufacturing PMI - March (9:45 AM ET)
● ISM Manufacturing Index - March (10:00 AM ET)
● Construction Spending - February (10:00 AM ET)
Tuesday, April 2
● JOLTs Job Openings & Quits Report - February (10:00 AM ET)
● Factory Orders - February (10:00 AM ET)
Wednesday, April 3
● Weekly MBA Mortgage Applications (7:00 AM ET)
● ADP Employment Change Report - March (8:15 AM ET)
● S&P Global Services PMI - March (9:45 AM ET)
● ISM Services PMI - March (10:00 AM ET)
● Weekly EIA Crude Oil Inventories (10:30 AM ET)
Thursday, April 4
● Weekly Initial & Continuing Jobless Claims (8:30 AM ET)
● Weekly EIA Natural Gas Inventories (10:30 AM ET)
Friday, April 5
● Employment Report - March (8:30 AM ET)
● Consumer Credit - February (3 PM ET)
International
Monday, April 1
● China: NBS Manufacturing & Mon-Manufacturing PMI - March
● China: Caixin Manufacturing PMI - March
Tuesday, April 2
● Eurozone: HCOB Manufacturing PMI - March
● UK: Bank of England Consumer Credit - February
● Germany: Inflation Rate (Preliminary) - March
Wednesday, April 3
● Japan: Jibun Bank Services PMI - March
● China: Caixin Services PMI - March
● Eurozone: Inflation Rate (Flash) - March
Thursday, April 4
● Eurozone: HCOB Services PMI - March
● UK: S&P Global Services PMI - March
● Eurozone - Produce Price Index - February
● UK: New Car Sales - March
Friday, April 5
● Germany: Factory Orders - February
● Eurozone: Retail Sales - February
As we begin a new month, companies will be hastily preparing to report their March quarter results beginning the week of April 15. Over the two weeks before that, some companies will report their quarterly results and what we learn will help refine expectations for what’s to come.
We will use those data points, along with the economic data we discussed above, to refine our expectations from our holdings for the quarter and the guidance they are poised to issue. Our thought is for a stock to power higher, the company behind it will have to deliver pristine results and beat consensus expectations with their view ahead. This was the case with December-quarter earnings, but given the market’s further advance over the last three months, which extended its P/E multiple even further, the earnings and guidance bar has risen as well.
With that being our plan, next week we will be digging into Dave & Buster’s (PLAY) as well as Lamb Weston (LW) for a read on consumer restaurant spending and additional insights into McDonald’s MCD business. Also next week, California’s controversial $20 minimum wage for quick-service restaurant workers employed by companies with 60 or more locations goes into effect. To prepare for this change, California restaurant owners are juggling some combination of multiple solutions, including raising menu prices, freezing hiring, shortening operational hours, and implementing AI solutions. Investments put in place by McDonald’s during the pandemic should take more of the sting out of this compared to others. Still, we will be interested in management comments that crystalize the expected impact.
This week McCormick & Co.’s (MKC) margins outlined what we are likely to hear from PepsiCo PEP on April 23, and next week we’ll be interested in ConAgra’s (CAG) grocery-related comments.
Here's a closer look at the earnings reports coming at us next week:
Monday, April 1
● Close: PVH (PVH)
Tuesday, April 2
● Open: Paychex (PAYX)
● Close: Dave & Buster’s (PLAY)
Wednesday, April 3
● Open: Acuity Brands (AYI)
● Close: Levi Strauss (LEVI), Sportsman’s Warehouse (SPWH)
Thursday, April 4
● Open: Lamb Weston (LW)
● Close: Conagra (CAG)
Friday, April 5
● Open: Greenbrier (GBX)
Portfolio Investor Resource Guide
● Economic Data: Here's a List of Links to the Key Economic Data We Closely Watch
● Investing Terminology: 16 Key Terms Club Members Should Know
● 10-Ks: Want to Know About a Stock? Read the Company's Reports
● 10-Qs: Unlock the Numbers and Key Information Behind Your Stock With the 10-Q
● Income Statement -Our Cheat Sheet to Understanding This Financial Document
● Balance sheet, Cash Flow Statements, and Dividends - How to Know If a Company Is Off-Kilter? Read Its Balance Sheet
● Valuation Metrics - Everyone Wants a Value. Here's How Investors Can Find
The Portfolio Ratings System
1 - Buy Now (BN): Stocks that look compelling to buy right now.
2 - Stockpile (SP): Positions we would add to on pullbacks or a successful test of technical support levels.
3 - Holding Pattern (HP): Stocks we are holding as we wait for a fresh catalyst to make our next move.
4 - Sell (S): Positions we intend to exit.
