Charting the S&P 500: Channel Narrows, But Trend Is in Place
Supporting indicators are still on buy signals.
You've reached your free article limit
You've read 0 of 1 free Pro articles.
Another week of new all-time highs for the stock market (save for the Russell 2000) is pretty bullish behavior. Couple that with strong breadth, good volume and a big skew of new highs over new lows and you have the ingredients for the trend to continue.
Friday’s action was dismal but was not nearly enough to erase the gains from earlier in the week. The surprising move up midweek vaulted the S&P 500 to new highs following a reactive move off the Federal Reserve policy decision. At the conclusion of that meeting, the committee decided to keep rates where they are but did say they will remain vigilant and pay attention to the data. The statement was basically identical to the January policy statement.
Once the news was out buyers were free to roam and pick up stocks of their liking. That bodes well for continuation on the weekly chart.
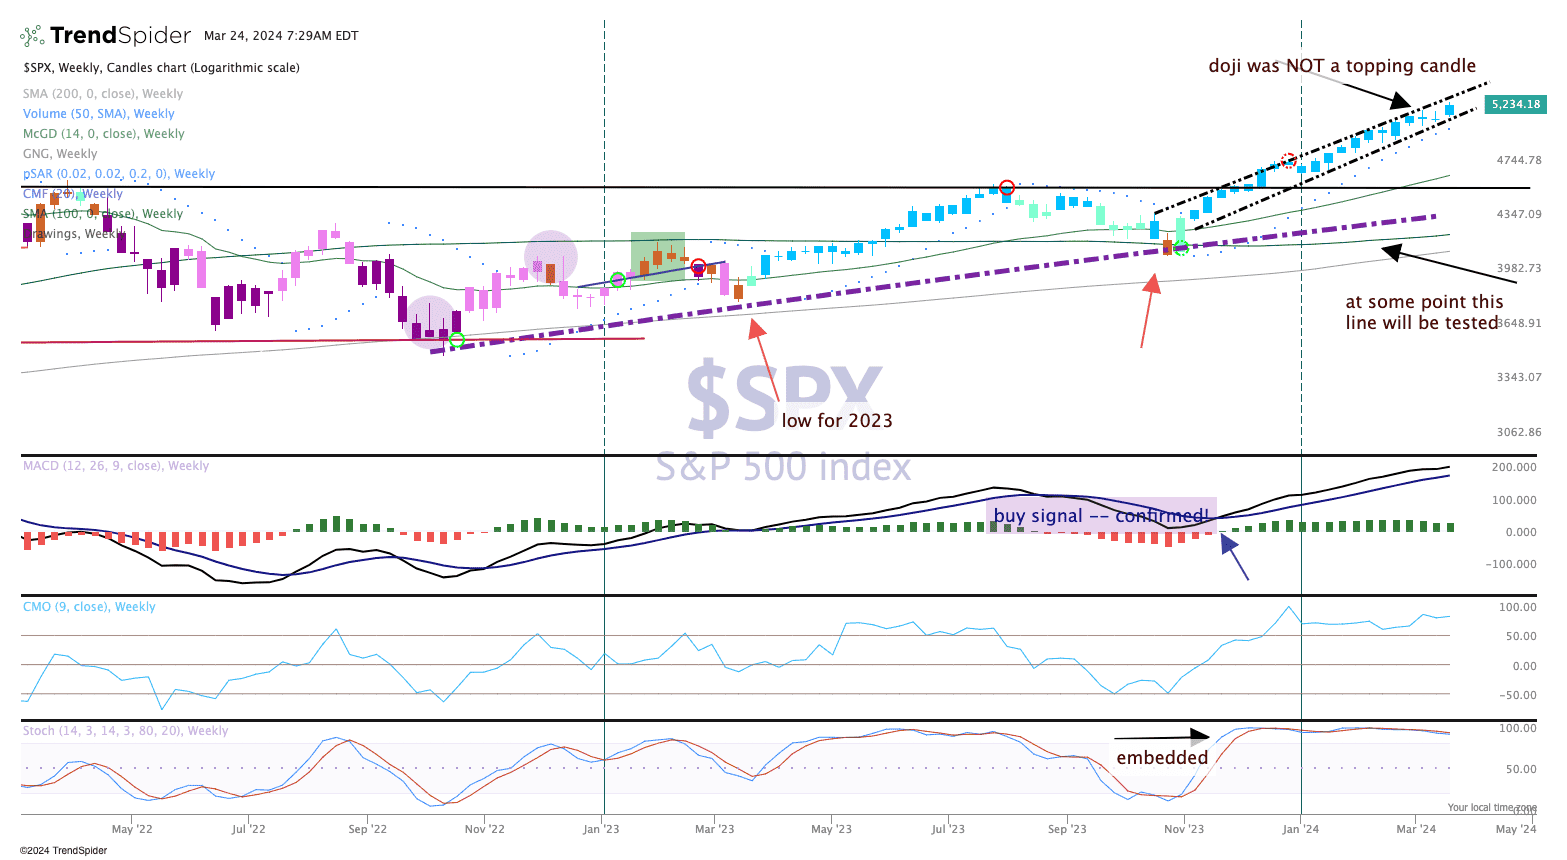
In the chart below, notice the channel we have drawn in the top pane. It continues to narrow but is making higher highs, higher lows.
We were concerned last week about a "double doji" on the chart, which may have been seen has a decisive point to turn the trend lower. That was not the case last week, though.
Remember, technical analysis is about observing what is happening and interpreting sentiment, momentum and emotional moves. The supporting indicators are still on buy signals, the Moving Average Convergence Divergence (MACD) remains overbought while the stochastics are embedded. This means that on pullbacks the "pros" (traders) will likely buy the dips to help push the market back up.
There's nothing wrong here with this chart -- the trend is in place.
View Chart » View in New Window »