Chart of the Day: Laboratory Corp Muscles Its Way Through Resistance
The life sciences company has been under tremendous selling pressure.
You've reached your free article limit
You've read 0 of 1 free Pro articles.
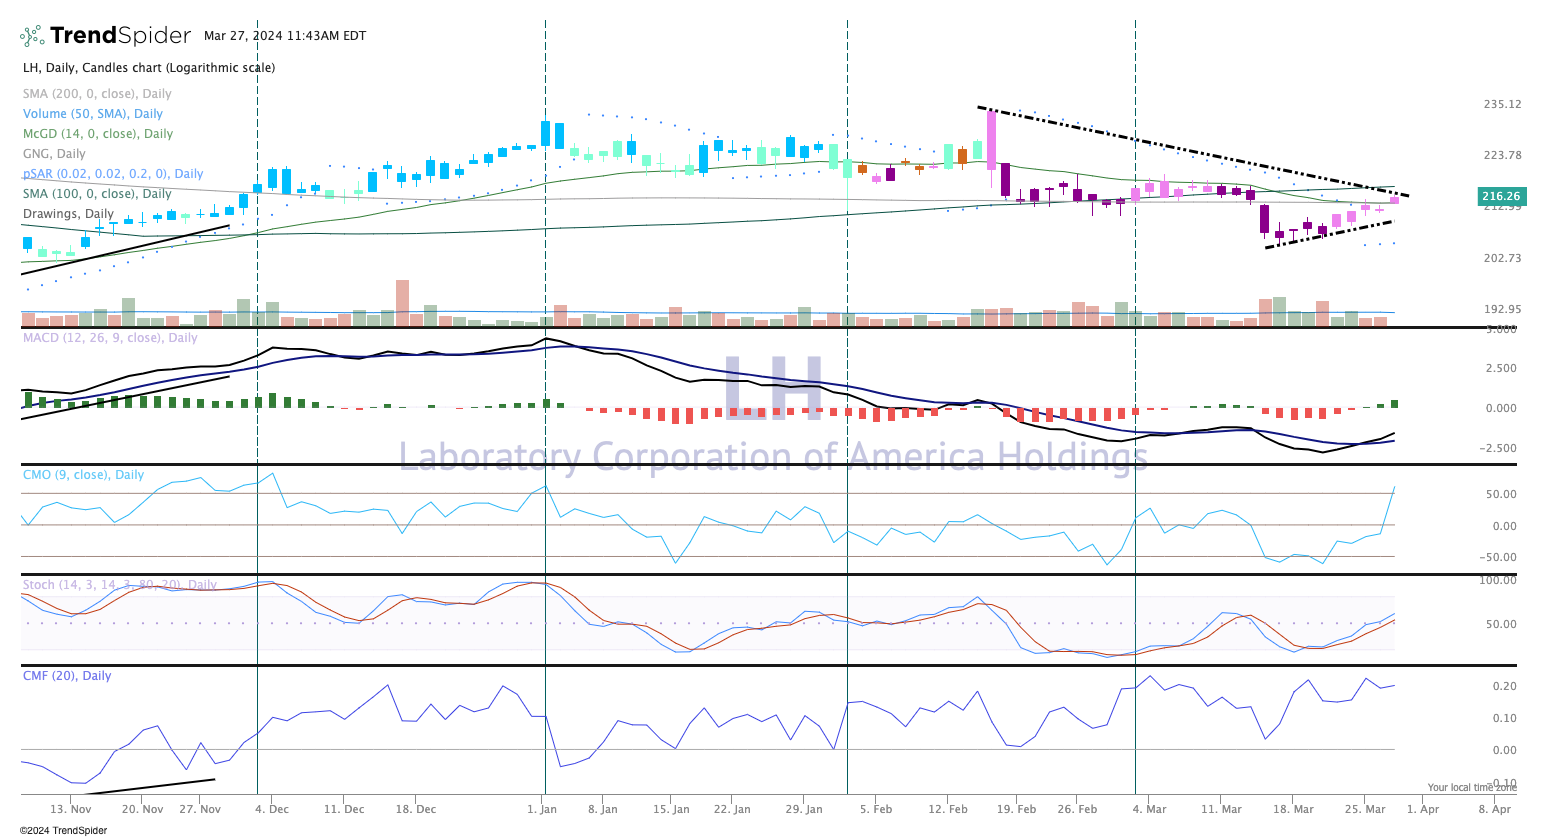
Bullpen name Laboratory Corp. of America LH has been trending downward since a negative response to their earnings report in mid-February. A series of lower highs and lower lows has plagued the stock for weeks, but more recently LH has produced a steady stream of higher highs, higher lows.
Yet, the overall downtrend is still in tact. Notice the candles are still pink or purple, which is bearish.
To view the chart in a new window, click here.
The supporting indicators are looking much better than the price chart. The MACD (moving average convergence divergence) has turned for a buy signal, money flow is much improved, while stochastics are on the rise.
Certainly these secondary indicators would support higher prices, but the price chart and volume is not quite in alignment with those indicators.
The best idea here is to wait to see how the drawn triangle plays out. A confirmed break above would be very bullish and perhaps attract our eye in adding it to TheStreet Pro Portfolio.
At the time of publication, TheStreet Pro Portfolio had no position in the securities mentioned.
