Weekly Roundup: A New Name Joins the Portfolio
We initiated a position in Builders FirstSource during a week that saw several notable outperformers.
You've reached your free article limit
You've read 0 of 1 free Pro articles.
Despite the market’s fade on Friday, the week, which included several new record highs for the S&P 500 and the Nasdaq Composite, was a positive one for the market. The improving inflation picture and noted conservatism in the Fed’s updated set of economic projections overshadowed the central bank trimming the number of potential rate cuts to just one for this year. It also led to Treasury yields to fall with the 10-year yield back to levels we haven’t seen since late March. While that combination lifted the market, it also placed the S&P 500 and Nasdaq Composite in overbought territory.
We discussed this Friday morning as well as the possibility of profit-taking by traders and other short-term investors following the market’s robust move since late April, which added to its already impressive climb since late October. If a larger pullback develops, it wouldn’t be the first time we’ve seen a low-to mid-single-digit drawdown in the market. Over the last 95 years, the S&P 500 has averaged three pullbacks of 5% or more every year.
If that were to happen, with the S&P 500 P/E multiple on expected 2024 EPS bumping up against the highs set over the last two years, we would view it as healthy for the market. It would also give us a reason to tap our shopping list.
If the market instead powers ahead, it could lead us to do some prudent portfolio trimming in positions that become much larger than 4.5% of the portfolio’s assets. With that in mind, two positions we will be keeping our eyes on are Universal Display OLED, which is up almost 20% quarter to date, and Nvidia NVDA, a workhorse of a stock that is up roughly 45% quarter to date.
In Friday’s video, we discussed how we will be sizing up EPS expectations for the second half of the year and into 2025 for the S&P 500. This will give us a new hurdle by which we can evaluate potential portfolio candidates but also revisit existing ones. As we approach the end of the current quarter, some investors may want to beat their chest over their performance. Instead, we’ll acknowledge the improved performance quarter to date due to the collective moves we’ve made in recent months but also focus our efforts on the road ahead.
The second half of the year tends to be seasonally strong for several of our holdings, including Apple AAPL, Qualcomm QCOM, Universal Display, PepsiCo PEP, and Coty COTY, we’ll be laying the groundwork for not only the balance of 2024 but the ensuing quarters.
Catching Up on the Portfolio This Week
Compared to the week’s gains for the S&P 500 and the Nasdaq Composite, we saw far superior moves in our shares of Universal Display, Nvidia, Apple, Applied Materials AMAT, and Marvell Technology MRVL. Other notable moves were had with the portfolio’s Qualcomm, Axon Enterprise AXON, Microsoft MSFT, and ServiceNow NOW.
Tempering those outperforming positions was the continued drift lower in PepsiCo and United Rentals URI. Late Friday, we scrutinized the underlying fundamentals and technicals for URI shares, opting to stick with the position and potentially add to it further. Next week brings the May Retail Sales report as well as quarterly results from Darden (DRI) and Kroger (KR), and those learnings will inform our next move with PEP shares.
The only move we made with the portfolio this week was to call up the shares of Builders FirstSource BLDR from the Bullpen, where they have been for several months. We set our initial panic point at $130 for this One-rated stock, which has a price target of $205. Our plan will be to build up this position brick by brick using either pullbacks in the share price or improving housing data to do so.
That means BLDR shares join our shopping list which includes Trade Desk TTD, Labcorp LH, Waste Management WM, PepsiCo, and ServiceNow. However, with our cash levels now back below 10% and barring any register ringing that would bring some additional cash into the fold, we will have to be selective with any next moves. As we prepare for that, we’ll be revisiting EPS expectations for the coming quarters relative to the S&P 500, but also noting which companies in the portfolio are entering their seasonally stronger times of the year.
This Week's Portfolio Videos and Podcasts
We cover a lot of ground during the week in our Daily Rundowns and the Portfolio Podcast. If you happened to miss one or more of them, here are some helpful links:
Monday, June 10: Our Roadmap for This Busy Week
Tuesday, June 11: More on Apple Intelligence and Our Plan for Coty
Tuesday, June 11: Let’s Rock with Ed Ponsi
Wednesday, June 12: Why the Market Shrugged Off Powell's Press Conference
Thursday, June 13: Let's Discuss Today's Market, Our New Position, and Broadcom
Friday, June 14: Setting the Stage for the Second Half of 2024
Key Global Economic Readings
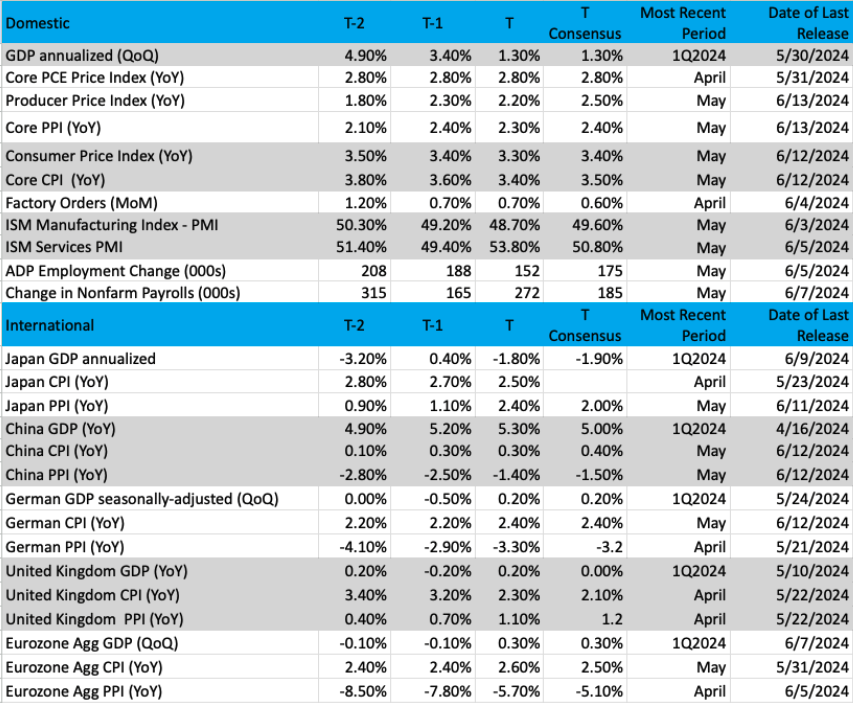
(Note: T is the most recent period, T-1 is the prior period's reading and T-2 is two periods back, the intent being to illustrate any trends)
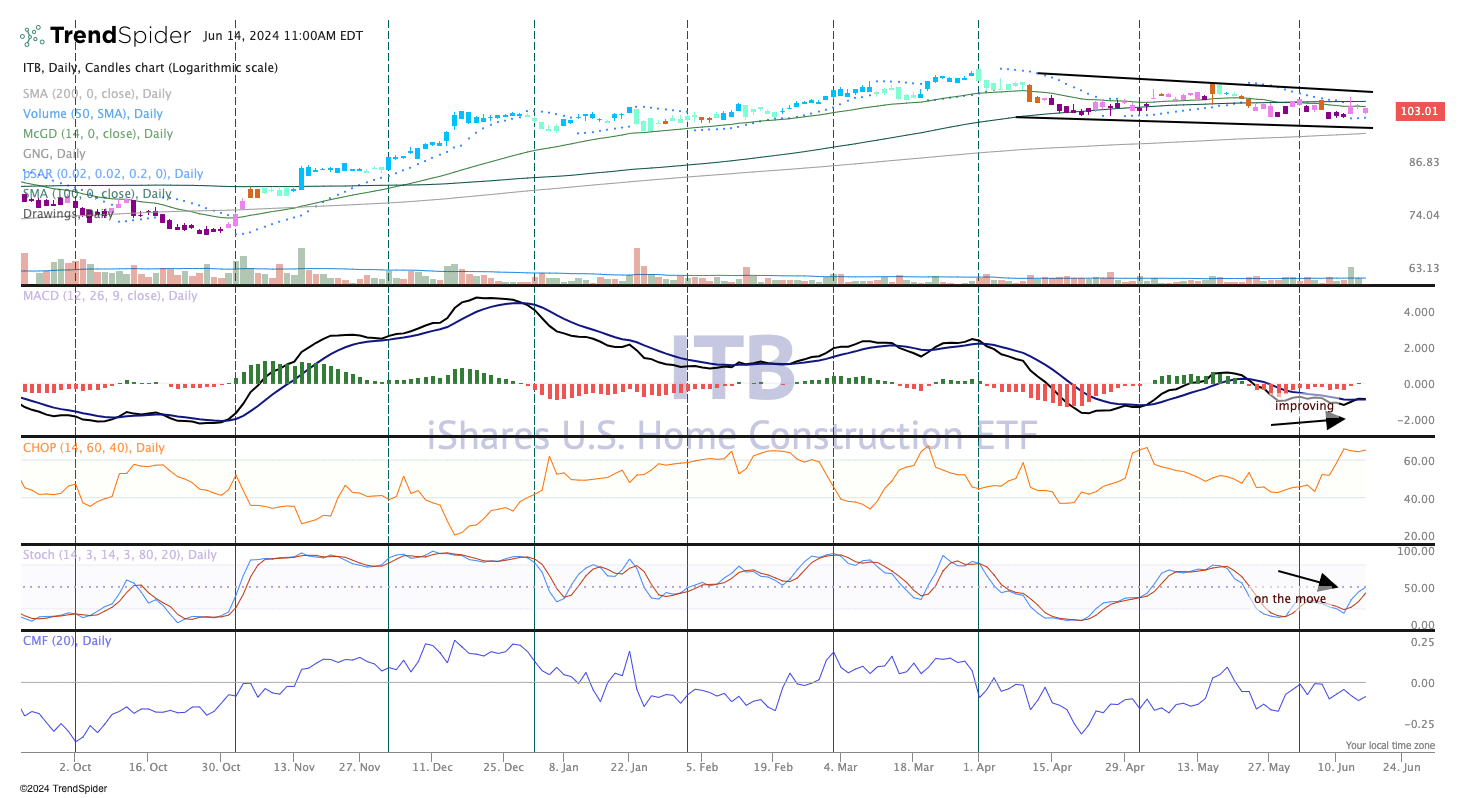
Chart of the Week: iShares U.S. Home Construction ETF (ITB)
There is no question the homebuilder group needs lower interest rates to keep the momentum moving. However, this last meeting of the Federal Reserve did not give us any clues as to when a rate-cut cycle is going to start. And while demand has been robust for new homes and builders since the end of the pandemic, we are seeing signs of a slowdown, at least in the employment data. As you know, there is a direct correlation between strong housing and strong employment. That correlation has held up nicely, until recently.
Now, it is way too soon to throw dirt on the homebuilders, even if rates remain stubbornly high. After seeing some pretty good data this week, the bond market has caught a bid, especially on the long end of the curve. The 10-year yield has fallen sharply towards 4.2%, basically daring the Fed to cut rates sooner rather than later. If this rings familiar, it should, as this was the same scenario between markets and the Fed at the start of 2024. The Fed won that battle. Will it happen again?
The chart of the iShares US Home Construction ETF (ITB) has been gliding gently lower for the past several weeks. That is quite fine, a pullback following a violent move higher is often needed before the next leg up begins. Notice in the chart the run from October 2023 to late March 2024, a monster rally on heavy turnover. That is big institutional buying with strong momentum. But now the ETF has cooled off and settled into a range, where the bottom seems to have been found at the $100 level.
Stochastics are starting to rise; hence momentum may be coming back into the ETF. Candles in the top pane are still pink or purple, a bearish reading on the GoNoGo indicator. That may change soon enough, especially if long-term rates stay low. That might stimulate more home buying and then the cycle gets started again. Above $103.50 and the ITB could be an interesting play.
Other charts we shared with you this week were:
Monday, June 10: S&P 500 - June Is Off to a Wild Start
Monday, June 10: Energy Select Sector SPDR Fund (XLE) - Energy Is in Need of a Lift
Tuesday, June 11: Vulcan Materials (VMC) - Vulcan Materials Looks Set to Test Major Support
Wednesday, June 12: First Trust Nasdaq Cybersecurity ETF (CIBR) - Cybersecurity Is Providing a Measure of Security
Thursday, June 13: Alphabet (GOOGL) - Alphabet Is a Steady Mover
Friday, June 14: Builders FirstSource (BLDR) - Builders FirstSource May Just Have Put in a Bottom
The Coming Week
Next week is a bit of a funky one as we have the Juneteenth holiday that will have U.S. markets closed on Wednesday. Paired with the end of the school year and folks getting an early jump on summer vacations, we could see lower-than-usual trading volumes. We won’t fall into that lull because of the data we have coming at us next week – the May reports for Retail Sales, Industrial Production, and Housing Starts as well as the June Flash PMI reports.
The May data will give rise to further GDP revisions from the Atlanta Fed’s rolling GDPNow model, which stood at 3.1% exiting this week. That figure was last updated on June 7, which means we could see a sizable revision when it’s next updated on Tuesday, June 18, and incorporates the latest Retail Sales and Industrial Production data.
When we get the Flash June PMI report from S&P Global on Friday, it will be the first hard look at the last month of the current quarter. As we tend to do, we will be sizing up what it has to say about the manufacturing and service economies, job creation, and inflation. The final May PMI reports from S&P Global agreed with those from ISM on the improving services sector but the two painted different pictures about the manufacturing one. The Flash PMI findings for June should help us determine which one of those was on the money.
We’ll also review the June Flash PMI reports for the eurozone for a few reasons. One is to get a read on-demand drivers from that bloc, but also to help determine what’s next for the dollar. Should the June Flash PMI data show further softening in eurozone inflation, the market may come around to thinking another rate cut by the European Central Bank could be sooner than later.
Here's a closer look at the economic data coming at us next week:
U.S.
Tuesday, June 18
· Retail Sales – May (8:30 AM ET)
· Industrial Production & Capacity Utilization (9:15 AM ET)
· Business Inventories – April (10:00 AM ET)
Thursday, June 20
· Housing Starts & Building Permits – May (8:30 AM ET)
· Jobless Claims – Weekly & Continuing (8:30 AM ET)
Friday, June 21
· S&P Global Manufacturing & Services PMI (Flash) - June (9:45 AM ET)
· Existing Home Sales – May (10:00 AM ET)
· Leading Indicators – May (10:00 AM ET)
International
Monday, June 17
· China: Retail Sales, Industrial Production – May
· Eurozone: Labor Cost Index (Final) - 1Q 2024
· Eurozone: Consumer Inflation Expectations - April
Tuesday, June 18
· Eurozone: Inflation Rate, CPI (Final) - May· Eu
rozone: ZEW Economic Sentiment Index - June
Thursday, June 20
· Eurozone: Consumer Confidence (Flash) - June
Friday, June 21
· Eurozone: HCOB Manufacturing & Services PMI (Flash) - June
There are only a handful of companies reporting next week that we will be paying close attention to. Because of our new position in Builders FirstSource and the stock market keeping the door open for more than one rate cut late this year, quarterly results and the outlook for the second half of 2024 from homebuilders Lennar (LEN) and K.B. Home (KBH) could reset expectations. Lennar (LEN) along with D.R. Horton (DHI), Pulte Homes (PHM), and Toll Brothers (TOL) are named as top 10 customers for Builders FirstSource, and we will be keenly interested in comments from Lennar management about outsourcing the manufacturing of certain products.
Comparing quarterly results and related metrics from Darden Restaurants (DRI) and Kroger (KR) should help us understand to what degree folks are shifting back to eating at home. Those learnings will be helpful as we examine our next move with PepsiCo (PEP) shares, which have traded off over the last week or so. We’ll also be interested in comments about Kroger’s private-label product sales given that we have TreeHouse Foods (THS) in the Bullpen.
Here's a closer look at the earnings reports coming at us next week:
Monday, June 17
· Close: Lennar (LEN)
Tuesday, June 18
· Close: KB Home (KBH)
Thursday, June 20
· Open: Accenture (ACN), Darden Restaurants (DRI), Kroger (KR)
Friday, June 21
· Open: CarMax (KMX)
Portfolio Investor Resource Guide
· Economic Data: Here's a List of Links to the Key Economic Data We Closely Watch
· Investing Terminology: 16 Key Terms Club Members Should Know
· 10-Ks: Want to Know About a Stock? Read the Company's Reports
· 10-Qs: Unlock the Numbers and Key Information Behind Your Stock With the 10-Q
· Income Statement -Our Cheat Sheet to Understanding This Financial Document
· Balance sheet, Cash Flow Statements, and Dividends - How to Know If a Company Is Off-Kilter? Read Its Balance Sheet
· Valuation Metrics - Everyone Wants a Value. Here's How Investors Can Find
The Portfolio Ratings System
1 - Buy Now (BN): Stocks that look compelling to buy right now.
2 - Stockpile (SP): Positions we would add to on pullbacks or a successful test of technical support levels.
3 - Holding Pattern (HP): Stocks we are holding as we wait for a fresh catalyst to make our next move.
4 - Sell (S): Positions we intend to exit.
