Charting the S&P 500: June Is Off to a Wild Start
Market volatility is rather low but sharp moves can be made.
You've reached your free article limit
You've read 0 of 1 free Pro articles.
The new month kicked off with some crazy action as last Monday/Tuesday saw the markets swoon to their lows by midday before a new set of money stepped in to pick up the market: the dip buyers. Yes, this group had been rather silent since last year when there were plenty of dips in a bull market trend to be bought. But this past week they were active and smartly so; the dip buying paid off when the stock market surged higher Wednesday.
The rest of the week was rather flat but with some volatility. Following the jobs report Friday, markets fell sharply but rallied hard only to finish about midway of the entire range of the day. That is what we call a doji, or a candle of indecision. Neither bulls nor bears had the advantage that day.
As we head into a very important week with a Fed meeting, inflation reports and some key earnings, the indexes find themselves trying to confirm a move to higher ground.
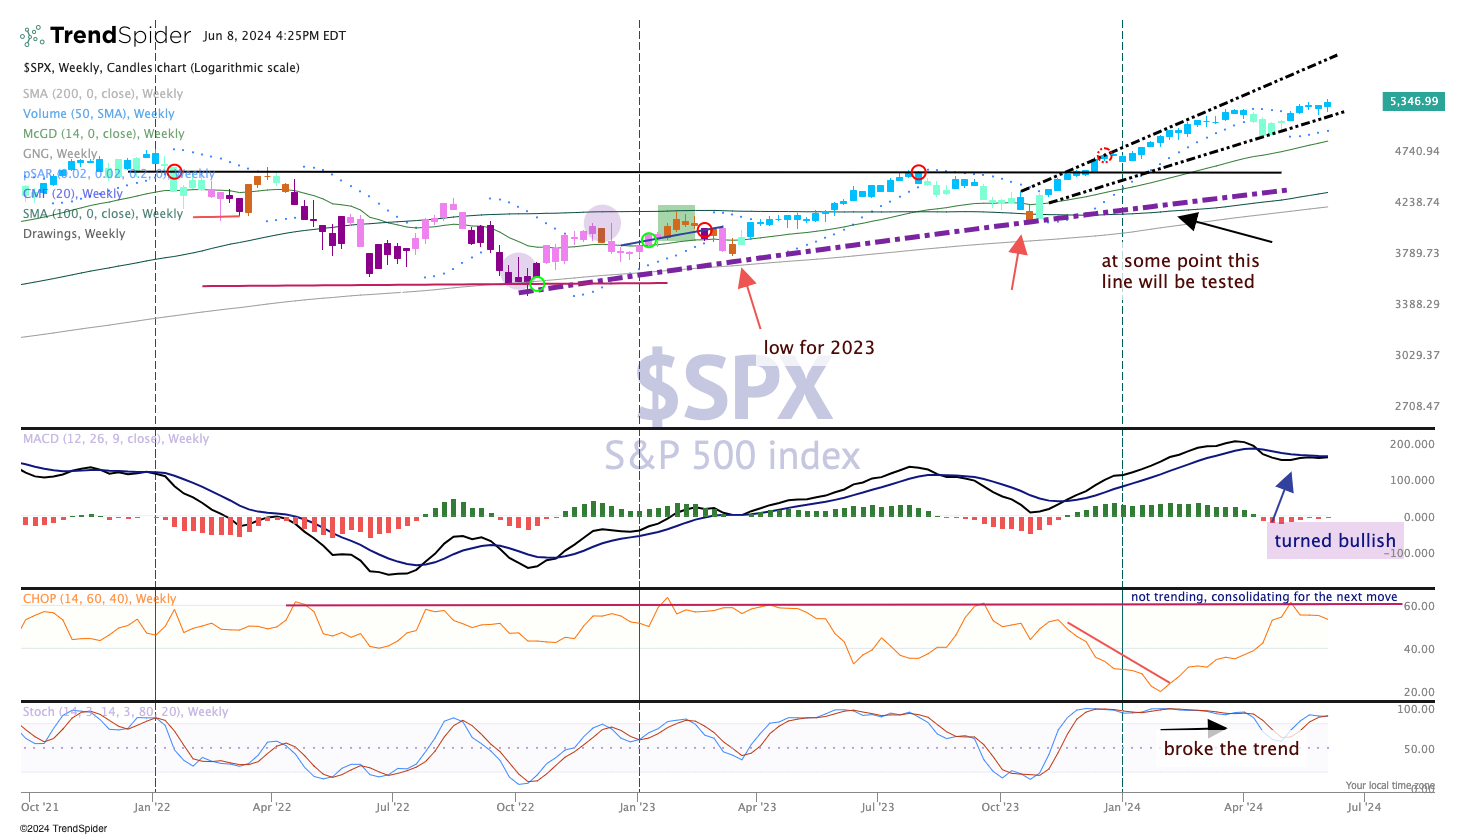
This past week was strong with a higher high, higher low (textbook uptrend) as the candles remain blue. That is considered an uptrend in the GoNoGo composite of indicators (top pane).
We also have the parabolic SAR (stop and reverse) in bull mode; this indicator tells us a change in trajectory of price before it happens.
Other indicators remain bullish, and while we expect another wild week with plenty of volatility to be seen, the trend remains up and the targets remain higher.
