Weekly Roundup: 5 Stocks Power the Portfolio
We initiated a new position in ServiceNow, rang the register on some huge gains, and upped several price targets during a busy week where five names led the portfolio higher.
You've reached your free article limit
You've read 0 of 1 free Pro articles.
While stocks limped to a finish on Friday following the May Employment Report that now has the market favoring no rate cut at the Fed’s September policy meeting, the S&P 500 closed the week near its record high.
Helping spur that market barometer along was the sizable move this week in Nvidia NVDA but also gains in Apple AAPL, Microsoft MSFT, Alphabet (GOOGL), and Amazon AMZN. Those five stocks, which account for almost 28% of the market cap-weighted S&P 500, are also portfolio holdings, which helped power the overall portfolio ahead this week. Because those same five stocks account for an even greater portion of the Nasdaq Composite, we can see why that market indicator closed ahead of the S&P 500 this week.
Based on the preponderance of May economic data this week — even though the Fed is poised to deliver comments next week that won’t support lingering hopes for a near-term rate cut — the market narrative for a healthy economy and earnings growth endures. In Friday’s video, we shared that we’re likely to sit on our hands with the portfolio ahead of Wednesday’s May CPI report, Fed policy meeting, and updated economic projections.
While we expect to see Fed Chair Powell reaffirm "higher for longer" and the need to see more good data before embarking on a rate-cutting cycle, especially after Friday’s May Employment report, we will be interested to see if the central bank continues to see the potential for a rate cut late this year. Because recent data suggest that first rate cut could slip into Q1 2025, should the Fed signal that is indeed a potential scenario it could be a bitter pill for the market to swallow. We say this because even after this week’s data, which led the Atlanta Fed to up its current quarter GDP figure and revealed inflation is not backing down, the CME FedWatch Tool still shows the market sees one to two rate cuts before year-end.
Wednesday’s core CPI print for May will bring a clearer picture of what the Fed is likely to say later that day. Based on those learnings, we’ll plot our next move with the portfolio’s shopping list. Shares of ServiceNow NOW, Labcorp LH, Waste Management WM, and several others are on that list. However, just because a stock is on the list doesn’t guarantee we will be buyers in the near term.
We’ll continue to be disciplined investors picking our spots accordingly, but if the market trades off following Powell’s comments we may have the opportunity to put some items on that shopping list to work.
Catching Up on the Portfolio This Week
Early in the week, we started a new position in the shares of ServiceNow NOW with a Two rating and a $840 price target. While it was a modest addition, right out of the gate NOW shares were a contributor to the portfolio. Meanwhile, prudent portfolio management led us to lock in a slice of significant gains for our holdings in Costco COST, Nvidia NVDA, and Qualcomm QCOM. Despite the modest trimming, we maintained sizable positions in all three to capture the upside we see ahead.
On Friday, we upped our price targets for Nvidia, Qualcomm, and Apple shares following monster May revenues reported by Taiwan Semiconductor (TSM). We also reiterated our One ratings on Marvell MRVL and Universal Display OLED.
With the portfolio’s cash position just over 11%, we’ll be judicious with our next moves. In preparing for those, we’ll be revisiting H2 2024 EPS growth expectations for the portfolio’s holdings. In doing so, we’ll keep in mind our preference for shares of companies whose EPS prospects are superior to those for the overall market.
This Week's Portfolio Videos and Podcasts
We cover a lot of ground during the week in our Daily Rundowns and the Portfolio Podcast. If you happened to miss one or more of them, here are some helpful links:
Monday, June 3: Our Road Map for a Busy Data Week
Tuesday, June 4: Why We Made Today’s Portfolio Trades
Wednesday, June 5: The Market is Moving Higher, But the Fed Won’t Overlook This
Thursday, June 6: We’ll Be Focusing on This Number in the May Jobs Report
Friday, June 7: Today’s Good News and Not-So-Good News
Key Global Economic Readings
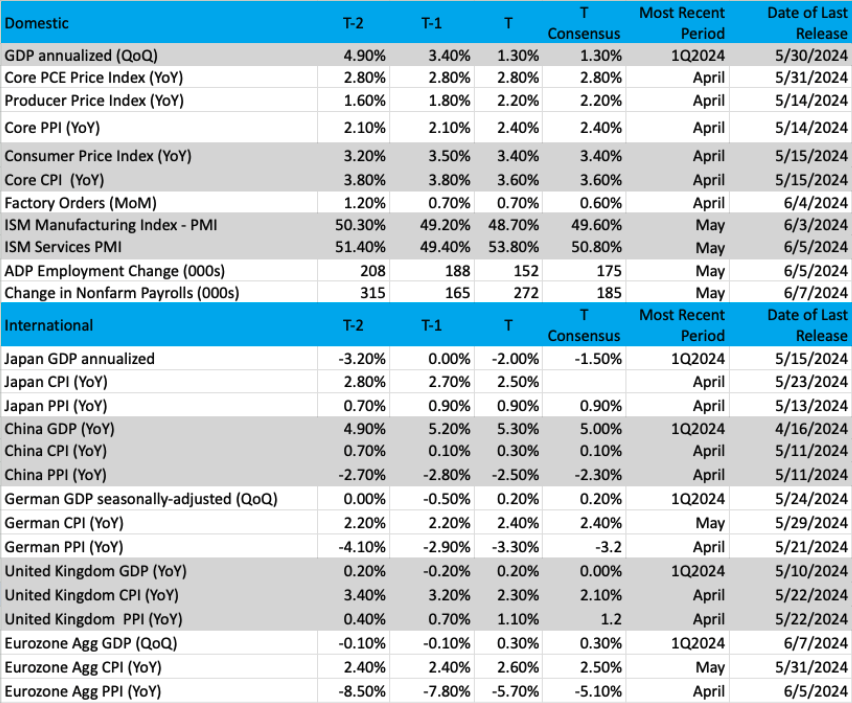
(Note: T is the most recent period, T-1 is the prior period's reading and T-2 is two periods back, the intent being to illustrate any trends)
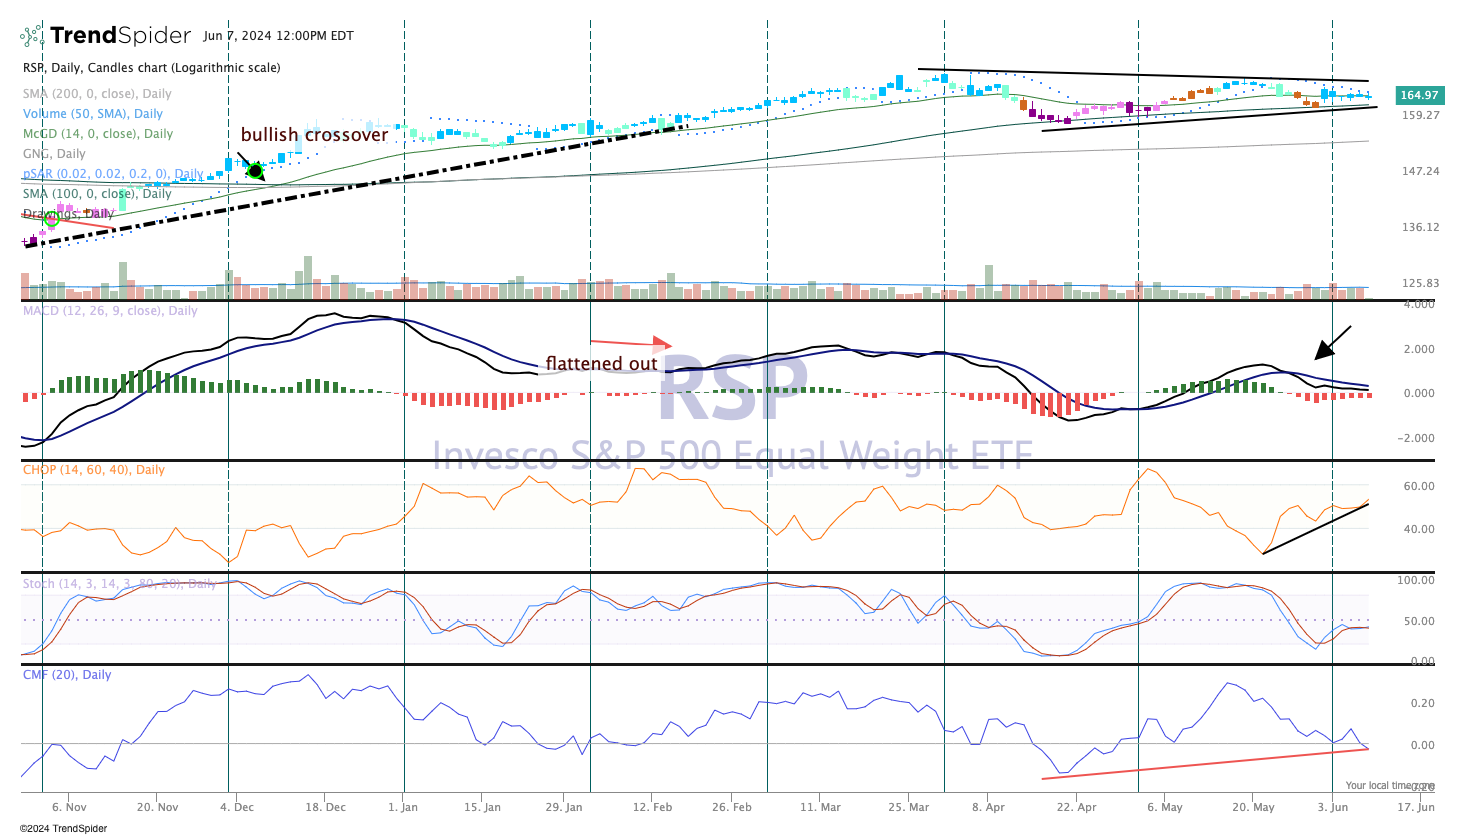
Chart of the Week: S&P 500 Equal Weight Index
When looking at the S&P 500 ETF proxy (SPY) we must take into consideration the market capitalization weighting of the index. It makes a huge difference, especially versus the Invesco S&P 500 Equal Weight Index (RSP).
What is this differential? Basically, a cap-weighted index heavily favors the most valuable companies. The index’s performance is greatly influenced by just a handful of members, like Nvidia, Apple, Microsoft, Alphabet, Meta, and Amazon. It is very similar to the U.S. House of Representatives, where the states with the largest populations have the highest representation (like California, Texas, and New York).
The RSP is equally weighted among all 500 members, so each company gets one vote (much like the U.S. Senate, where each state is represented equally). So, the influence of Apple on the RSP is the same as say Uber (UBER). Over the long term, both the SPY and RSP tend to be highly correlated, but there are times, such as 2023 and the recent environment, when these ETFs diverge.
When the SPY is outperforming the RSP, as it is now, the heavily weighted components of the basket have the most influence, and the market advance is not broad. Most strategists would say a higher-quality bullish move would mean the RSP is performing as well, if not better than the SPY because it would signal a broader-based movement. That is not to say the RSP cannot produce strong results; for 2024, this ETF is up nearly 5% so far this year but the SPY is up a more commanding 12.45%. That is quite the divergence. If the RSP catches up to the SPY, the market breadth will likely be much healthier with more stocks participating.
Looking at the RSP chart, below, it shows a steady uptrend from the lows in April. Candles are blue, which on the GoNoGo indicator reflects a bullish trend. Money flow at the bottom has receded to the zero line and the Moving Average Convergence Divergence (MACD) is on a sell signal. Volume trends are bearish as well, but we have bullish divergences in the chart, meaning the price action is strong and constructive.
Keep an eye on this RSP, if we see better performance later in the year it would be a positive sign for the bulls.
Other charts we shared with you this week were:
Monday, June 3: S&P 500 - After Strong Finish to May, What's in Store for June?
Monday, June 3: Morgan Stanley (MS) - Morgan Stanley Pulls Back to Support
Tuesday, June 4: ServiceNow (NOW) - A Technical Look at Our Latest Portfolio Holding
Wednesday, June 5: Mastercard (MA) – Mastercard May Be Telling Us Something
Thursday, June 6: Costco (COST) – Costco Looks Poised for Even Higher Prices
The Coming Week
This past week was a big one for May economic data — and the sum of it all pushed the Atlanta Fed’s GDPNow model to a GDP figure of 3.1% for the current quarter. The main drivers were the strength found in the May Service PMI reports and the combination of stronger-than-expected job creation and wage gains in Friday’s May Employment Report. Those forces also pushed back hard on the market’s expectation for rate cuts and likely set the stage for another round of sobering comments about the timeing of rate cuts from the Fed once it concludes its next policy meeting this coming Wednesday afternoon.
The findings in this week’s PMI reports and wage data set the stage for next week’s May CPI, which will be published the morning of June 12, making it the last data point before the Fed concludes its latest monetary policy meeting. Expectations are for the central bank to leave interest rates unchanged following that meeting.
As we parse the policy statement and get ready for Fed Chair Powell’s press conference comments, we’ll compare the updated set of Fed economic projections against the ones published in March. Odds are we’ll see some revisions for GDP, rate cuts, and inflation, all of which should support the higher-for-longer message Powell is likely to deliver.
Following the Fed meeting, we’ll get another look at inflation courtesy of the May PPI report as well as Import/Export pricing data for the month. And with the Fed’s pre-policy meeting quiet period ending, we’ll see Fed officials once again making the rounds. They will likely largely reiterate the Fed’s updated policy message from Wednesday, but we’ll be listening for subtle shifts around the edges in their messaging.
Here's a closer look at the economic data coming at us next week:
U.S.
Tuesday, June 11
· NFIB Small Business Optimism Index – May (6:00 AM ET)
Wednesday, June 12
· MBA Mortgage Application Index – Weekly (7:00 AM ET)
· Consumer Price Index – May (8:30 AM ET)
· EIA Crude Oil Inventories – Weekly (10:30 AM ET)
· FOMC Rate Decision, Fed Economic Projections (2:00 PM ET)
· Treasury Budget – May (2 PM ET)
Thursday, June 13
· Jobless Claims (Initial & Continuing) - Weekly (8:30 AM ET)
· Producer Price Index – May (8:30 AM ET)
· EIA Natural Gas Inventories – Weekly (8:30 AM ET)
Friday, June 14
· Import/Export Prices – May (8:30 AM ET)
· The University of Michigan Consumer Sentiment Index (Preliminary) - May (10:00 AM ET)
International
Monday, June 10
· Eurozone: Consumer Inflation Expectations - April
Wednesday, June 12
· China: Inflation Rate, PPI - May
Thursday, June 13
· Eurozone: Industrial Production - April
Friday, June 14
· China: Outstanding Loan Growth - May
The pace of quarterly earnings reports slows to a trickle next week, but even so, there will be ones from Broadcom (AVGO), Kroger (KR), and Adobe (ADBE) that bear watching.
Similar to this week, taking up the earnings report slack will be the next wave of investor conferences, which will keep us busy as managements comment about the current quarter and H2 2024. Some of those conferences are:
· Wells Fargo Industrials Conference
· Goldman Sachs Global Healthcare Conference
· Nasdaq Investor Conference
· Mizuho Technology Conference
· Wells Fargo Industrial Conference
· Oppenheimer Consumer Growth and E-Commerce Conference
· JPMorgan Capital Goods Conference
· Morgan Stanley US Financials Payment & Commercial Real Estate Conference
At those events, several portfolio holdings will be presenting, including Morgan Stanley (June 10), Universal Display (June 12), Elevance Health (June 12), and Coty (June 13).
Here's a closer look at the earnings reports coming at us next week:
Tuesday, June 11
· Close: Casey’s General Store (CASY).
Wednesday, June 12
· Close: Broadcom (AVGO), Dave & Buster’s (PLAY).
Thursday, June 13
· Open: Signet Jewelers (SIG), Kroger (KR)
· Close: Adobe (ADBE).
Portfolio Investor Resource Guide
· Economic Data: Here's a List of Links to the Key Economic Data We Closely Watch
· Investing Terminology: 16 Key Terms Club Members Should Know
· 10-Ks: Want to Know About a Stock? Read the Company's Reports
· 10-Qs: Unlock the Numbers and Key Information Behind Your Stock With the 10-Q
· Income Statement: Our Cheat Sheet to Understanding This Financial Document
· Balance sheet, Cash Flow Statements, and Dividends: How to Know If a Company Is Off-Kilter? Read Its Balance Sheet
· Valuation Metrics: Everyone Wants a Value. Here's How Investors Can Find
The Portfolio Ratings System
1 - Buy Now (BN): Stocks that look compelling to buy right now.
2 - Stockpile (SP): Positions we would add to on pullbacks or a successful test of technical support levels.
3 - Holding Pattern (HP): Stocks we are holding as we wait for a fresh catalyst to make our next move.
4 - Sell (S): Positions we intend to exit.
ONES
Alphabet GOOGL; $174.46; 1,035 shares; 4.14%; Sector: Communication Services
WEEKLY UPDATE: GOOGL shares rebounded following last week’s drift lower, putting them up more than 25% quarter to date – nearly double the S&P 500’s move over the same period. In a regulatory filing, the company named Anat Ashkenazi, as the new Chief Financial Officer and Senior Vice President of Alphabet and Google LLC, effective July 31. Ms. Ashkenazi has served as Executive Vice President and Chief Financial Officer of Eli Lilly and Company (LLY), where she has worked for over 23 years. This week, we read reports about layoffs in Google Cloud, which reaffirms the view Google is focused on growing an increasingly profitable cloud business. During the week, Google Cloud announced an expanded partnership with Workday (WDAY) that will bring new generative AI capabilities to enhance how customers build and manage apps on Workday. And you should mark your calendar for June 17, the day Alphabet will pay its first quarterly dividend of $0.20 per share to shareholders of record as of June 10. We continue to see Google’s business and the shares as well positioned to capture the accelerating shift to digital advertising, especially in a presidential election year, as well as the cloud. Given Google’s reach, our thinking continues to be the company will be a meaningful player in AI. The next layer of support for the shares is near $165. The company will pay its first quarterly dividend of $0.20 per share on June 17 to shareholders of record on June 10.
1-Wk. Price Change: 1.1%; Yield: 0.5%
INVESTMENT THESIS: We believe that while search and digital ad dominance are what will carry shares in the near- to mid-term, longer-term it is the company's artificial intelligence "moat" that will provide for new avenues of growth. AI is what has made the company's search, video, and targeted ad capabilities best-in-class and is the driving force behind the company's success in voice (Google Home) and autonomous driving (Waymo). Furthermore, we believe it is this AI expertise that will also make the company more prevalent in other industries, including healthcare via its subsidiary Verily, as AI and machine learning continue to disrupt operations across industries. Lastly, adding to our positive view of the company's future opportunities, we believe that Alphabet's free cash flow generation and solid balance sheet set it apart and are what will allow the company to continue taking chances on far-out ground-breaking and potentially world-changing projects. The company is also preparing to roll out Gemini Subscription with enterprise plans for workspace, according to a report. All good news for Alphabet.
Target Price: Reiterate $200; Rating: One
Panic Point: $145
RISKS: Regulatory risk (data privacy), competition, and macroeconomic slowdown impacting consumers and therefore ad buyer activity.
Amazon AMZN; $184.30; 835 shares; 3.53%; Sector: Consumer Discretionary
WEEKLY UPDATE: It was a solid week for Amazon AMZN shares with the stock higher every day on decent turnover. The recent move to the 100-day moving average was a good test for the stock because it had been fairly oversold following a pullback. The close above the key 20-day moving average has turned the trend bullish. Note, that a prior pullback to the 100-day was the start of a 15% launch in a few weeks. The MACD is also turning up for a buy signal. Earlier in the week ARK Fund’s Cathie Wood announced she had bought nearly $10 million of Amazon stock for the fund. Amazon also made a streaming deal with the NBA which could be an eventual boon to their advertising business. We will watch developments associated with Amazon union workers in New York joining the Teamsters, hoping for some leverage from the largest private sector union in the country.
1-Wk. Price Change: 4.5%; Yield: 0.0%
INVESTMENT THESIS: We believe upside will result from Amazon's continued eCommerce dominance, AWS's continued leadership in the public cloud space, and ongoing growth of the company's advertising revenue stream, which feeds off Amazon's eCommerce business. Additionally, we believe profitability will continue to improve as AWS and advertising account for a larger portion of total sales as both these segments sport higher margins than the eCommerce operation. While we believe the increasing share of the revenue from these higher margin businesses will be key to driving profitability longer-term, we think margins on eCommerce stand to improve as the company's infrastructure is further built out and economies of scale further kick in. The embedded call option is that management is always looking to enter a new space and generate new revenue streams.
Target Price: Reiterate $220; Rating: One
Panic Point: $155
RISKS: High valuation exposes the stock to volatile swings, eCommerce has exposure to slower consumer spending and competition, management is not afraid to invest heavily, potential headwinds resulting from new eCommerce regulation in India, and management is not scared to invest aggressively for growth, which can at times cause volatile reactions as near-term concerns arise relating to the impact on margins.
Axon Enterprise AXON; $280.50; 623 shares; 4.00%; Sector: Aerospace & Defense
WEEKLY UPDATE: Axon shares have been rangebound the last few weeks, and remain below levels at which we recently picked up some additional shares. During the week, we discussed that TJX Cos. (TJX) is equipping some store employees with body cameras to thwart shoplifting and keep customers and employees safe. We also shared a report about law enforcement adopting AI-based virtual agents. Both play into Axon’s strengths and should drive demand for the company’s recurring revenue and higher-margin cloud business. While we are interested in rounding out our position size, we also note the late February price gap in the shares between $272-$281. Should AXON shares become oversold, that could be a factor that leads us to do some incremental buying. We will also be watching other technical indicators, including the MACD reading.
1-Wk. Price Change: -0.4%; Yield: 0.00%
INVESTMENT THESIS: Axon Enterprise develops, manufactures, and sells conducted energy devices and cloud-based digital evidence management software designed for use by law enforcement, corrections, military forces, private security personnel, and private individuals for personal defense. The company operates in two segments: Taser and Software & Sensors. Taser develops and sells CEDs used for protecting users and virtual reality training. Software & Sensors manufactures fully integrated hardware and cloud-based software solutions such as body cameras, automated license plate reading, and digital evidence management systems. Axon delivers its products worldwide and gets most of its revenue from the United States. President Biden's fiscal year 2023 budget requests a fully paid-for new investment of approximately $35 billion to support law enforcement and crime prevention -- in addition to the President's $2 billion discretionary request for these same programs. According to Mordor Intelligence, the wearable, and body-worn cameras market on its own was valued at $1.62 billion in 2020 and is expected to reach $424.63 billion by 2026.
Target Price: Reiterate $375; Rating: One
Panic Point: $270
RISKS: Manufacturing and supply chain, competitive factors, government regulation, technology change.
Coty Inc. COTY ; $10.02; 15,540 shares; 3.57%; Sector: Consumer Discretionary
WEEKLY UPDATE: As we expected, Coty management gave an investor presentation this week that supported our bullish stance on the company and its shares. All in all, the presentation reinforced the opportunity we see in COTY as CEO Sue Nabi’s transformation plan accelerates in the coming quarters and Coty continues to de-lever its balance sheet. From a fundamental perspective, share gains and expanding margins support a bullish stance on the stock. When Nabi was named CEO in mid-2020, the company’s adjusted EBITDA margin was 11.64% and for fiscal 2024 it is closing in on 18% with more room to expand in the coming quarters. Turnaround plans can be a slow burn, but as the momentum builds the results become increasingly evident. We are starting to see that at Coty, and we want to capture that value creation in COTY shares. We admit we may be early in seeing this, but over time the market should catch up to our thinking, especially during the seasonally strong second half of the calendar year. Coty management will make another investor conference presentation next week at the Evercore IS Consumer & Retail Conference on June 13.
1-Wk. Price Change: -3.3%; Yield: 0.0%
INVESTMENT THESIS: Founded in Paris in 1904, Coty is one of the world's largest beauty companies with a portfolio of iconic brands across fragrance, color cosmetics, and skin and body care. Coty serves consumers around the world, selling luxury and mass-market products in more than 130 countries and territories. The company derives almost 45% of its revenue from the Americas, 44% from Europe, the Middle East, and Africa, and the balance from Asia Pacific. By revenue category, Prestige drives 62% of Coty's revenue but more than 80% of its operating income with the balance derived from its Consumer Beauty segment. Management intends to further grow the Prestige business, expanding its prestige fragrance brands, through the ongoing expansion into prestige cosmetics, and the building of a comprehensive skincare portfolio leveraging existing brands. Management is also targeting margin improvement at its Consumer Beauty brands as well as expanding its presence in China across both of its reporting segments. China's beauty and personal care market is expected to grow at a quicker pace of 5.4% per annum through 2027, putting it at $70 billion-$75 billion by 2027.
Target Price: $14; Rating: One
Panic Point: $9.00
RISKS: Industry competition and consolidation, product efficacy and safety, currency, and brand licensing.
Marvell Technology MRVL; $67.99; 2,420 shares; 3.77%; Sector: Technology
WEEKLY UPDATE: Marvell’s chart shows the stock has come under some pressure recently with heavy volume to the downside. High-volume selloffs such as the one we had last week in Marvell indicated big investors were taking profits following the pronounced climb in the shares ahead of its recent earnings report. While it wouldn’t be the first stock that got ahead of itself, we see further upside ahead due to strong AI and data center chip demand, and the eventual demands that will place on networking and carrier infrastructure spending. During the week, JPMorgan shared Marvell should be one of the companies that dominate the high-end custom chip market, one that it sees growing at a 20% compound annual growth rate. We see Marvell’s custom chip relationships with Google, Meta (META), and Amazon supporting that view. Following Taiwan Semi’s strong May revenue print, on Friday, we reiterated our buy and a $95 target for MRVL shares.
1-Wk. Price Change: -1.2%; Yield: 0.4%
INVESTMENT THESIS: Marvell is a fabless supplier of high-performance standard and semi-custom infrastructure semiconductor solutions. These solutions power the data economy, enabling the data center, carrier infrastructure, enterprise networking, consumer, and automotive/industrial end markets. With roughly 75%-80% of Marvell's revenue stream tied to digital infrastructure, we see it continuing to benefit from rising content consumption and creation. Pointing to that rising demand that necessitates network densification and the build of digital infrastructure, Ericsson sees global monthly average usage per smartphone reach 46 gigabytes (GB) by the end of 2028 vs. 19 GB in 2023 and 15 GB in 2022.
Target Price: Reiterate $95; Rating: One
Panic Point: $59
RISKS: Technology risk, customer risk, competition risk, reliance on manufacturing partners, and supply chain constraints.
Nvidia Corp. NVDA; $1,208.88; 151 shares; 4.18%; Sector: Technology
WEEKLY UPDATE: Nvidia has been a workhorse for the portfolio in the current quarter. That outsized gain and prudent portfolio management led us to book a slice of its more than 50% gain early this week. Later in the week, one of the catalysts we’ve been waiting for, the May revenue report from Taiwan Semiconductor, arrived, and the strength led us to boost our NVDA price target to $1,320 from $1,250. With the completion of the coming 10-for-1 stock split, that target will get adjusted to $132 and the number of shares in the portfolio will increase to 1,510. Remember, our overall position size for the portfolio will be unchanged following this largely cosmetic event. Turning to the NVDA chart, it remains very bullish but also overbought. Remember, overbought is not a reason to sell, but a pullback could certainly be looked at as an opportunity. As of now, the stock is about 20% above the 20-day moving average, which is not sustainable. This means we could see the stock move sideways, or perhaps dip to the 20-day. Bank of America believes the company has a multi-year lead on AMD and gave NVDA a pre-split price target of $1,500 per share.
1-Wk. Price Change: 10.3%; Yield: 0.0%
INVESTMENT THESIS: Nvidia is well positioned to benefit from ramping AI and data center spending. The company pioneered accelerated computing to help solve the most challenging computational problems. Nvidia is now a full-stack computing infrastructure company with data-center-scale offerings that are reshaping the industry. The company's full stack includes the foundational CUDA programming model that runs on all Nvidia GPUs, as well as hundreds of domain-specific software libraries, software development kits, or SDKs, and Application Programming Interfaces, or APIs. This deep and broad software stack accelerates the performance and eases the deployment of Nvidia accelerated computing for computationally intensive workloads such as artificial intelligence, or AI, model training and inference, data analytics, scientific computing, and 3D graphics, with vertical-specific optimizations to address industries ranging from healthcare and telecom to automotive and manufacturing. Nvidia reports in two business segments: Compute & Networking and Graphics. The Compute & Networking segment (78% of revenue, 85% of operating income) is comprised of Data Center accelerated computing platforms and end-to-end networking platforms including Quantum for InfiniBand and Spectrum for Ethernet; NVIDIA DRIVE automated-driving platform and automotive development agreements; Jetson robotics and other embedded platforms; Nvidia AI Enterprise and other software; and DGX Cloud software and services. The Graphics segment (22% of revenue, 15% of operating income) includes GeForce GPUs for gaming and PCs, the GeForce NOW game streaming service and related infrastructure; Quadro/NVIDIA RTX GPUs for enterprise workstation graphics; virtual GPU, or vGPU, software for cloud-based visual and virtual computing; automotive platforms for infotainment systems; and Omniverse Enterprise software for building and operating metaverse and 3D internet applications.
Target Price: $1,320; Rating One
Panic Point: $875
RISKS: Market and interest rate risk, credit risk, country risk, and operational risk, including cybersecurity.
The Trade Desk TTD; $94.17; 1,570 shares; 3.39%; Sector: Technology
WEEKLY UPDATE: TTD shares posted some nice gains this week, adding to those over the last few weeks. We continue to see the company well positioned for the accelerating shift to digital advertising across multiple platforms, especially streaming. In the current wave of investor conferences, we’ll be listening for comments about digital advertising trends for H2 2024, which should benefit from the 2024 presidential campaign. We have a sliver of room to add to the portfolio’s TTD position, but we will be disciplined buyers given our $85.43 cost basis.
1-Wk. Price Change: 1.5%; Yield: 0.0%
INVESTMENT THESIS: The Trade Desk offers a cloud-based ad-buying platform that empowers its clients to plan and manage data-driven digital advertising campaigns across ad formats and channels, including video, display, audio, digital-out-of-home, and social. Modalities for those campaigns span a multitude of devices, such as computers, mobile devices, televisions, and streaming devices. This positions the Trade Desk to benefit from an accelerating shift toward digital advertising. That shift is expected to see digital advertising account for more than 70% of total ad spending in 2025 rising to ~74% by 2027. We also see the company benefitting from the use of digital advertising in the 2024 presidential campaign, which is expected to grow more than 150% compared to 2024, putting it around $3.5 billion.
Target Price: Reiterate $110; Rating: One
Panic Point: $79
RISKS: Advertising spending; customer risk and loss; evolving market dynamics and competitive landscape; platform disruptions and outages.
United Rentals URI ; $643.40; 232 shares; 3.42%; Sector: Industrials
WEEKLY UPDATE: Construction spending during April 2024 was estimated at a seasonally adjusted annual rate of $2,099.0 billion, 0.1% below the revised March estimate of $2,101.5 billion. On a year-over-year basis, total construction spending for the month rose 10%, continuing the strong double-digit growth that has been led by non-residential construction. Total non-residential construction spending, up 11.5% year over year, reflects continued spending tied to infrastructure stimulus spending out of Washington. We see that in the 16.4% jump in highway and street construction spending versus year-ago levels, 14.8% for power and other double-digit gains. On Wednesday, the ADP May Employment Change report, which showed a pick up in construction hiring suggests spring and summer construction activity is poised to accelerate given the lack of winter weather. That along with the recent pullback in URI shares led us to boost our rating on the stock to One from Two.
1-Wk. Price Change: -3.9%; Yield: 1.0%
INVESTMENT THESIS: United Rentals (URI), the largest equipment rental company in the world, operates throughout the United States and Canada, and has a limited presence in Europe, Australia, and New Zealand. It serves industrial and other non-construction; commercial (or private non-residential) construction; and residential construction. Industrial and other non-construction rentals represented approximately 50% of rental revenue, primarily reflecting rentals to manufacturers, energy companies, chemical companies, paper mills, railroads, shipbuilders, utilities, retailers, and infrastructure entities; commercial construction rentals represented approximately 46% of rental revenue, primarily reflecting rentals related to the construction and remodeling of facilities for office space, lodging, healthcare, entertainment, and other commercial purposes; and residential rentals around 4% of revenue. We see the company benefiting on three fronts — the seasonal uptick in construction spending; the release of funds and projects associated with the five-year Biden Infrastructure Bill; and the company's nip-and-tuck acquisition strategy that should further enhance its geographic footprint. In January, the company announced a fresh $1 billion buyback authorization following the completion of $4 billion in share repurchases over the 2012-2021 period.
Target Price: Reiterate $750; Rating: One
Panic Point: $600
RISKS: Industry and economic risk, competition and competitive pressures, and acquisition risk.
Universal Display OLED; $183.03; 965 shares; 4.05%; Sector: Technology
WEEKLY UPDATE: Shares of Universal Display OLED surged ahead this week, building on other gains over the last few weeks. Quarter to date, our shares are up more than 8%, making OLED a nice contributor to the portfolio. Powering this week’s advance was more confirmation that the smartphone market is improving. On Friday, we reiterated our OLED price target of $225 and our One rating following Taiwan Semi’s strong May revenue report. The next catalyst to watch will be Apple’s WWDC keynote and what it tells us about the expected AI-on-device upgrade cycle. With roughly 50% of the smartphone market penetrated by organic light-emitting diode displays, 3% of the TV market, and 2% of the PC and tablet market, we see a long runway ahead for OLED shares even before we factor in automotive lighting and the general illumination market. We continue to see the foldable smartphone market as another product model that would drive incremental demand for Universal’s product offering.
1-Wk. Price Change: 4.2%; Yield: 0.9%
INVESTMENT THESIS: Universal Display focuses on the development and commercialization of organic light-emitting diode (OLED) technologies and materials for use in display and solid-state lighting applications. OLED displays are capturing a growing share of the display market, especially in the mobile phone, television, monitor, wearable, tablet, notebook, personal computer, augmented reality (AR), virtual reality (VR), and automotive markets. This adoption reflects advantages over competing display technologies with respect to power efficiency, contrast ratio, viewing angle, video response time, form factor, and manufacturing cost. Universal's business strategy is to develop new OLED materials and sell existing and new materials to product manufacturers for display applications, such as mobile phones, televisions, monitors, wearables, tablets, portable media devices, notebook computers, personal computers, and automotive applications, and specialty and general lighting products. The company also looks to license its OLED material, device design, and manufacturing technologies to those manufacturers. As such, Universal has a significant portfolio of proprietary OLED technologies and materials with more than 5,500 patents issued and pending worldwide.
Target Price: Reiterate $225; Rating: One
Panic Point: $145
RISKS: Patent and Intellectual property protection; maintaining OLED manufacturing and customer relationships; technology risk; market risk.
Vulcan Materials Company VMC ; $247.59; 613 shares; 3.48%; Sector: Building Materials
WEEKLY UPDATE: Shares of Vulcan Materials VMC have been in a steady decline of lower highs, and lower lows over the last month, falling to the April lows. If the stock holds here, we could see a double bottom formed, and a resumption of the uptrend. That would be bullish. However, if the $248-$250 fails to hold there is a potential date with the 200-day moving average near $233. On the positive side of things, both the RSI and MACD are nearly oversold. From a fundamental perspective, total construction spending during April 2024 was estimated at a seasonally adjusted annual rate of $2,099.0 billion, up 10% year over year, continuing the strong double-digit growth that has been led by non-residential construction. Total non-residential construction spending, up 11.5% year over year, reflects continued spending tied to infrastructure stimulus spending out of Washington. We see that in the 16.4% jump in highway and street construction spending versus year-ago levels, 14.8% for power and other double-digit gains. On Wednesday, the ADP May Employment Change report, which showed a pick up in construction hiring suggests spring and summer construction activity is poised to accelerate given the lack of winter weather. We see that supporting our stance on VMC shares. Morgan Stanley recently shared “US aggregates are our preferred way of maintaining exposure to US construction themes”, and we aren’t ones to disagree. On Friday, Vulcan paid its latest quarterly dividend of $0.46 per share to shareholders as of May 24.
1-Wk. Price Change: -3.2%; Yield: 0.7%
INVESTMENT THESIS: Vulcan Materials operates primarily in the U.S. and is the nation's largest supplier of construction aggregates (primarily crushed stone, sand, and gravel), a major producer of asphalt mix and ready-mixed concrete, and a supplier of construction paving services. Its products are the indispensable materials used in building homes, offices, places of worship, schools, hospitals, and factories, as well as vital infrastructure including highways, bridges, roads, ports and harbors, water systems, campuses, dams, airports, and rail networks. Ramping spending associated with the Biden Infrastructure Law should drive demand for Vulcan's products over the coming years. Vulcan has historically complemented its organic growth prospects by acquiring businesses to expand its geographic reach and product scope. Since 2014, the company has acquired more than two dozen companies, including the 2021 acquisition of U.S. Concrete. That combination has allowed the company to deliver steady top and bottom-line growth over the last decade, with only a modest decline when the pandemic hit in 2020.
Target Price: Reiterate $310; Rating: One
Panic Point: $225
RISKS: General economic and business conditions; dependence on the construction industry; timing of federal, state, and local funding for infrastructure; changes in the level of spending for private residential and private nonresidential construction.
TWOS
Apple AAPL ; $196.89; 790 shares; 3.56%; Sector: Technology
WEEKLY UPDATE: We boosted our Apple AAPL price target to $230 from $220 on Friday following the monster May revenue report delivered by Taiwan Semiconductor (TSM). The continued strength in TSM’s revenue reinforces the improving outlook for smartphone demand. That view was reinforced by comments from Citi that third-party data points to Apple’s iPhone demand stabilizing in China. Also this week, BofA shared Apple App Store revenue for the 66 days of the current quarter has increased 11% year over year, according to data published by SensorTower. This builds on other recent data showing that development. We continue to see further acceleration ahead led by the looming AI-on-device upgrade cycle. We’ll get a good look at that next week with Apple’s WWDC keynote on Monday, June 10. The company is expected to showcase its AI efforts across its various software platforms, but we will also be listening to which device models will be eligible for those updates. Based on what is revealed, we may revisit our price target yet again.
1-Wk. Price Change: 2.4%; Yield: 0.5%
INVESTMENT THESIS: While we acknowledge that near-to-midterm performance remains heavily influenced by iPhone sales, the dynamic is shifting as investors finally place greater emphasis on Services growth. We are bullish on the 5G upgrade cycle and believe longer-term upside will continue to come as Services revenue grows its share of overall sales. Services provide for a recurring revenue stream at higher margins, a factor that serves to reduce earnings volatility while allowing for a higher percentage of sales to fall to the bottom line; as a result, we believe that Services growth and the installed base, are much more important than how many devices the company can sell in each 90-day period. In addition to improved profitability, we also believe the transparent nature of this revenue stream will demand an expanded price-to-earnings multiple as segment sales grow. Furthermore, we believe that Apple's desire to push deeper into the healthcare arena will help make its devices invaluable as more life-changing features are added and the company works to democratize health records. Lastly, also see upside resulting from increased adoption of wearables (think the Apple Watch) and potential new product announcements such as an AR/VR headset or an update on Project Titan, the company's secretive autonomous driving program.
Target Price: Reiterate $230; Rating: Two
Panic Point: Reiterate $155
RISKS: Slowdown in consumer spending, competition, lack of new product innovation, elongated replacement cycles, failure to execute on Services growth initiative.
Applied Materials Inc. AMAT ; $221.73; 460 shares; 2.34%; Sector: Semiconductor Manufacturing
WEEKLY UPDATE: Shares of Applied Materials AMAT moved higher this week, bringing the position's year-to-date gain to more than 35%. The catalyst for this latest move was Barclay’s upgrade of the shares to Equal Weight from Underweight and the corresponding price target boost to $225 from $165. What led Barclays to throw in the towel in its previous rating was the "robust uptick" in China spending and aggressive capex plans in the U.S. that set up a more favorable environment in 2025 and beyond. During the week, Applied Management presented at the Bank of America Technology conference and comments focused on reshoring programs for chip capacity and the AI tailwind that should drive chip equipment spending for the next several years. Friday’s robust May revenue report supports that multi-year view and it reaffirms our thinking for rising chip industry capacity utilization levels, another factor that could spur better-than-expected demand for chip equipment. We continue to see Applied’s financials improving as rising chip capacity utilization levels drive incremental chip equipment demand and the impact of reshoring spending, like the U.S. CHIPS Act, kicks in.
1-Wk. Price Change: 3.1%; Yield: 0.7%
INVESTMENT THESIS: Applied provides manufacturing equipment, services, and software to the semiconductor, display, and related industries. With its diverse technology capabilities, Applied delivers products and services that improve device performance, power, yield, and cost. Applied's customers include manufacturers of semiconductor chips, liquid crystal, and organic light-emitting diode displays, and other electronic devices. Applied operates in three reportable segments: Semiconductor Systems (73% of 2022 revenue, 78% of 2022 operating income), Applied Global Services (22%, 19%), and Display and Adjacent Markets (5%, 2%). Key customers include Samsung (12% of 2022 sales), Taiwan Semiconductor (20%), and Intel (10%).
Target Price: Reiterate $240; Rating: Two
Panic Point: $180
RISKS: Manufacturing and Supply Chain, Competitive Factors, Government Regulation, Technology Change.
Bank of America Corp. BAC ; $39.78 ; 4,000 shares; 3.65%; Sector: Financial Services
WEEKLY UPDATE: Bank of America BAC shares have been one of the best performers in the bank/financials group. The shares are bumping right up against $40, levels not seen since the decline of the stock got underway in 2022. Volume trends have been bullish, the uptrend is intact with a series of higher highs, and higher lows. The 20-day moving average has been great support. Last week BAC dipped below but ended up closing above there, something we see as extremely bullish. During the week Piper Sandler reiterated an underweight on the company with a price target of $37. Interest rates may be a factor for the bank going forward but with a strong May jobs report but higher inflation that could mean higher mortgage rates going forward. For BofA’s investment banking business, the pace of new M&A deals continued this week, including the one accounted for by our own Waste Management for Stericycle. The latest EY Pantheon Deal Barometer forecasts that 2024 US corporate M&A deal volume will increase by 20% this year and US private equity M&A deal volume will be up 16%. EY sees that strength continuing into 2025 because its EY CEO Outlook survey points to an increase in CEOs looking to make acquisitions and a big rise in those looking to divest assets. We are also seeing the IPO market continue to firm in the US and we are starting to see signs of a rebound in the European IPO market following a two-year pause. IPO pipelines continue to grow, and recent IPO performance suggests the offering window should remain open. As we see more transactions announced and prices, we’ll revisit our $41 target for BAC shares. BofA will pay its next quarterly dividend of $0.24 on June 28 to shareholders of record on June 7.
1-Wk. Price Change: -0.6%; Yield: 2.4%
INVESTMENT THESIS: Bank of America is one of the world's leading financial institutions, serving individual consumers, small and middle-market businesses, and large corporations with a full range of banking, investing, asset management, and other financial and risk management products and services. The company provides unmatched convenience in the United States, serving approximately 67 million consumer and small business clients with approximately 3,900 retail financial centers, approximately 16,000 ATMs, and award-winning digital banking with approximately 56 million verified digital users. Bank of America is a global leader in wealth management, corporate and investment banking, and trading across a broad range of asset classes, serving corporations, governments, institutions, and individuals around the world. Bank of America offers industry-leading support to approximately 3 million small business households through a suite of innovative, easy-to-use online products and services. The company serves clients through operations across the United States, its territories, and approximately 35 countries. From a reporting basis, the company's business breaks down as follows: Net Interest Income breakdown: Consumer Banking 57%, Global Banking 23%, Global Wealth & Investment Management 14%, and Global Markets 6%; Income Before Tax breakdown: Consumer Banking 42%, Global Banking 27%, Global Wealth & Investment Management 16%, and Global Markets 15%. Bank of America pays a quarterly dividend of $0.22 per share.
Target Price: $41; Rating: Two
Panic Point: $33
RISKS: Financial markets, fiscal, monetary, and regulatory policies, economic conditions, and credit ratings.
Costco Wholesale COST ; $845.58; 210 shares; 4.07%; Sector: Consumer Staples
WEEKLY UPDATE: Portfolio discipline led us to trim back the portfolio’s position in COST shares early in the week, locking a sizable gain. Wednesday night the company delivered knockout May comp sales leading us to lift our COST price target to $880 from $850. We weren’t alone as Oppenheimer hiked its target to $905 from $850. We will continue to update ours as the company delivers upcoming monthly sales reports. The much-anticipated membership price increase would be another reason for us to do so.
1-Wk. Price Change: 4.4%; Yield: 0.5%
INVESTMENT THESIS: We like Costco's long-term prospects, driven by a club-based operating model that focuses on volumes, not margins, and therefore offers its customers a value proposition of everyday low prices. The strength of this model has created an incredibly loyal customer base with low churn and continued share gains in both bricks-and-mortar and e-commerce. This is a global concept, evidenced by the strength of sales both in the U.S. and abroad, which includes an emerging China opportunity. We see the company's membership model as a key differentiator vs. other retailers and its plans to open additional warehouse locations in the coming quarters should drive retail volumes and the higher-margin membership fee income as well. We also appreciate management's approach to capital returns and their willingness to return cash when it is in excess on the balance sheet.
Target Price: Reiterate $880. Rating: Two
Panic Point: $675
RISKS: Inability to pass through higher costs, fuel prices, weaker consumer, and membership churn.
Elevance Health ELV; $538.94; 275 shares; 3.40%; Sector: Health Care
WEEKLY UPDATE: ELV shares rebounded nicely over the last few days following JPMorgan raising its ELV price target to $631 at the end of last week and Bank of America boosting its to $646 from $621 this week. BofA’s call centered on multiple expansion given that it sees the company on a “path to consistent additional low teens annual returns.” While news on Elevance and its shares comes in dribs and drabs, ELV shares are up mid-double digits so far this year, putting them on a path to our $560 target. Management will present on June 12 at the Goldman Sachs 45th Annual Global Healthcare Conference and based on what we learn we’ll address our price target as needed. Our focus will be on margins and management’s plans to further expand the company’s Medicare Advantage footprint.
1-Wk. Price Change: 0.1%; Yield: 1.2%
INVESTMENT THESIS: Elevance, formerly Anthem/Blue Cross Health, is a premier healthcare brand that appears to be in the sweet spot for HMO companies. Mostly domestic, this company has a wide reach and coverage across the U.S., serving more than 118 million people via medical, pharmacy, clinical, and care solutions. Founded in 1944, Elevance offers a terrific business model that works in boom or bust economic times. The opportunity to find a company with reliable and dependable revenue and cash flows is right here with Elevance. Revenue growth for this company has surged in recent years, with better than double-digit growth since 2018 as the company thrived during the pandemic.
Target Price: Reiterate $560; Rating: Two
Panic Point: $450
RISKS: With any insurance business the risk is high for changes in regulation and government programs. Since the onset of Obamacare more than 10 years ago, companies like Elevance have changed their model to be more in line with a better cost/benefit analysis, reducing waste and squeezing out excesses (as was outlined and suggested in Obamacare). Separately, as the population increases and ages, there is more opportunity for Elevance to grow, but with those changes, there is a risk. Lastly, competition is brisk with some very strong opponents who keep their costs low (Humana, Cigna, UNH, CVS/Healthnet).
The Energy Select Sector SPDR Fund XLE ; $89.99; 1,345 shares; 2.77%; Sector: Energy
WEEKLY UPDATE: Despite a rebound late in the week, oil prices and our XLE shares moved lower this week. While OPEC+ announced they would extend production cuts into H2 2024, the group also shared plans to start phasing out those cuts in October. Oil prices were also hit by the weaker-than-expected picture of the U.S. manufacturing economy painted by the May PMI report from ISM. The May PMI report from S&P Global painted a very different picture for May's manufacturing activity, and we’ll be watching upcoming data to see which of the two was on the mark. The Caixin China General Manufacturing PMI rose to 51.7 in May from 51.4 the prior month, with manufacturing production rising at the fastest pace in almost two years. Rising backlogs and new orders for the region bode well for manufacturing activity, and that means we will continue to watch supply-demand dynamics for oil. We’ll have a technical look at XLE shares early next week, and that may provide some potential entry points for newer members.
1-Wk. Price Change: -3.5%; Yield: 3.7%
INVESTMENT THESIS: The Energy Select Sector SPDR Fund is an exchange-traded fund that tracks the performance of the Energy Select Sector Index. The ETF holds large-cap U.S. energy stocks. It invests in companies that develop & produce crude oil & natural gas and provide drilling and other energy-related services. The holdings are weighted by market capitalization.
Target Price: Reiterate $100; Rating: Two
Panic Point: $84
RISKS: Interest rates, weakness in the broad economy, energy prices.
First Trust Nasdaq Cybersecurity ETF CIBR ; $53.82; 2,530 shares; 3.12%; Sector: Cybersecurity
WEEKLY UPDATE: Shares of this ETF that give us broad-based cybersecurity exposure were little changed this week, keeping it a modest drag on the portfolio’s quarter-to-date performance. That is despite another batch of headlines on the latest hacks and cyber-attacks We continue to think all investors should have exposure to cybersecurity, especially as bad actors harness the power of AI in their attacks. We like the diversified exposure we have with the CIBR ETF. With the shares hovering above support near $51-$52, we will remain prudent buyers of the shares.
1-Wk. Price Change: 0.9%; Yield: 0.0%
INVESTMENT THESIS: The First Trust Nasdaq Cybersecurity ETF seeks investment results that correspond generally to the price and yield (before the fund's fees and expenses) of an equity index called the Nasdaq CTA Cybersecurity Index. The Nasdaq CTA Cybersecurity Index is designed to track the performance of companies engaged in the cybersecurity segment of the technology and industrial sectors. It includes companies primarily involved in the building, implementation, and management of security protocols applied to private and public networks, computers, and mobile devices to protect the integrity of data and network operations. To be included in the index, a security must be listed on an index-eligible global stock exchange and classified as a cybersecurity company as determined by the Consumer Technology Association. Each security must have a worldwide market capitalization of $250 million, have a minimum three-month average daily dollar trading volume of $1 million, and have a minimum free float of 20%.
Target Price: Reiterate $62; Rating: Two
Panic Point: Reiterate $48
RISKS: Cybersecurity spending, technology, and product development, the timing of product sales cycle, new products, and services in response to rapid technological changes and market developments as well as evolving security threats.
Labcorp Holdings Inc. LH ; $196.60; 610 shares; 2.75%; Sector: Healthcare
WEEKLY UPDATE: Shares of Labcorp LH rebounded nicely this week, but remain below our cost basis and on our portfolio shopping list. During the week, Labcorp announced new strategic service offerings within its precision oncology portfolio. The enhancements strengthen Labcorp's leadership as a premier, single-source partner for biopharmaceutical companies in advancing cancer research and patient care both in the United States and globally. We see this as the latest in a growing line of new offerings that should support continued growth in testing volumes, especially given the domestic demographic shift better known as the aging population. Labcorp will pay its next quarterly dividend of $0.72 per share on June 12 to shareholders of record on May 28.
1-Wk. Price Change: 0.9%; Yield: 1.5%
INVESTMENT THESIS: Labcorp is a global leader in innovative and comprehensive laboratory services that provides vital information to help doctors, hospitals, pharmaceutical companies, researchers, and patients make clear and confident decisions. By leveraging its diagnostics and drug development capabilities, the company provides insights and accelerates innovations to improve health and improve lives. The Company is organized under two segments, consisting of Diagnostics Laboratories (Dx), which includes routine testing and specialty/esoteric testing, and Biopharma Laboratory Services (BLS), consisting of Early Development Research Laboratories and Central Laboratory Services. Our attraction to LH shares stems from the combination of the aging population driving diagnostic testing growth and the increasing array of diagnostic testing as well. That combination is expected to drive the healthcare testing services market to $12.6 billion by 2029, from $7.4 billion in 2024, according to Markets and Markets. To augment its position in oncology, women's health, autoimmune diseases, and neurology, the company has been expanding through acquisitions and partnerships with health systems and regional local labs.
Target Price: Reiterate $235; Rating: Two
Panic Point: Reiterate $170
RISKS: Macroeconomic factors, changes in healthcare reimbursement models and products, government regulations, product discontinuations or recalls.
Lockheed Martin Corp. LMT; $470.13; 330 shares; 3.56%; Sector: Aerospace & Defense
WEEKLY UPDATE: Lockheed Martin shares were little changed this week despite the company being awarded a $1.93 billion Army contract modification for High Mobility Artillery Rocket Systems. Also this week, Lockheed signed an agreement with Firefly Aerospace, for up to 25 launches on the company's Alpha rocket through 2029. Late in the week, Barron’s published a bullish article on LMT, calling out CFRA upgrading the shares to "Strong Buy" from "Hold" with a price target of $557 and Seaport Research’s $551 target. The article also calls out Lockheed’s backlog supports more than two years’ worth of sales. With countries like Germany in talks to buy additional F-35s, we could see that backlog and visibility stretch out even further. We continue to the re-ramp of F-35 shipments as a “when” not “if” issue, considering its backlog at the end of March of $159 billion including 373 F-35s. We will continue to monitor geopolitical tensions and the U.S.’s willingness to deliver additional weapons to its allies as well as non-U.S. defense spending.
1-Wk. Price Change: 0.6%; Yield: 2.7%
INVESTMENT THESIS: Lockheed Martin is the largest defense contractor globally and has dominated the Western market for high-end fighter aircraft since the F-35 program was awarded in 2001. Lockheed's largest segment is aeronautics, which is dominated by the massive F-35 program. Lockheed's remaining segments are rotary and mission systems, which is mainly the Sikorsky helicopter business; missiles and fire control, which creates missiles and missile defense systems; and space systems, which produces satellites and receives equity income from the United Launch Alliance joint venture. Historically, the stability of defense spending has been a haven during periods of economic uncertainty, and we see that repeating once again even as geopolitical conflicts are likely to lead to incremental demand for Lockheed's products. The company has increased its dividend consistently over the last 19 years and is widely expected to boost it again in the coming days. In October 2022, Lockheed announced its board authorized the purchase of up to an additional $14.0 billion of LMT stock under its share-repurchase program.
Target Price: $520; Rating: Two
Panic Point: $385
RISKS: Contracts and budget risk with the U.S. government and the Department of Defense, F-35 program funding and renewal, competition, and subcontractor issues.
Mastercard MA; $449.79; 275 shares; 2.83%; Sector: Info. Tech
WEEKLY UPDATE: During the week Mastercard MA and its partners launched new product initiatives in Uruguay, Hong Kong, Shanghai, and other markets. Temenos (TMSNY) announced a collaboration with Mastercard to accelerate the implementation and delivery of Mastercard Move, Mastercard's portfolio of money transfer capabilities, to banks and their customers. Mastercard also recently launched its first peer-to-peer (P2P) transaction infrastructure feature, the Mastercard Crypto Credential, to facilitate cross-currency cross-border payments and domestic transfers on the blockchain for users in Latin America and Europe. These are examples of Mastercard’s ongoing efforts to grab more share of the global payments market. While we monitor those developments, we are also watching ones for transaction volumes, which are a key driver of Mastercard’s revenue. According to data from the San Francisco Fed, households burned through the last of their $2.1 trillion of pandemic-era excess savings in March. The drawdown has pushed more and more to rely on credit cards and credit bureau TransUnion estimates 440,000 credit-card holders have been downgraded to subprime status over the last year. Our thinking is this could force a shift toward debit card payments from credit cards, but when it comes to Mastercard all that matters is the transaction tap or swipe. Still, we will continue to monitor real wage growth and consumer spending trends. Should we that spending soften we may have to reconsider Mastercard’s place in the portfolio.
1-Wk. Price Change: 0.6%; Yield: 0.6%
INVESTMENT THESIS: Mastercard is a card network company that benefits from the secular shift away from cash transactions and toward card-based and electronic payments. On Covid-19 dynamics, we view MA as a "reopening" play and an economic recovery play within technology because its cross-border volumes fell sharply during the pandemic but will rebound as mobility increases and travel restrictions ease. Mastercard has more international exposure relative to Visa (V), making its growth outlook more susceptible to new travel restrictions. However, we view MA as the better long-term play as we are betting on that inevitable recovery.
Target Price: Reiterate $490 Rating: Two
Panic Point: $400
RISKS: The recovery in cross-border transactions, regulation in the payments market, competition from other fintechs, and pricing pressures.
Microsoft Corp. MSFT; $423.85; 377 shares; 3.66%; Sector: Technology
WEEKLY UPDATE: Microsoft MSFT shares clawed back most of last week’s move lower, putting them back into double-digit territory quarter to date. Oppenheimer boosted its MSFT price target to $500 on Friday from $450, sharing its view Microsoft has positioned itself as the top artificial intelligence platform due to its tight partnership with OpenAI. Central to its view, Oppenheimer predicts GPT-5 will be released by year's end and further entrench OpenAI and Microsoft's pole position in generative AI. Time will tell, but we would not be surprised if the increasingly competitive landscape spurs OpenAI to accelerate its product development efforts. During the week, Microsoft issued new updates across Microsoft’s Azure AI Services including Azure AI Studio being available as a key component of the Microsoft Copilot stack, and available in Azure AI Studio and as an API. We continue to follow reports that a bipartisan group of four U.S. senators, led by majority leader Chuck Schumer, have called for at least $32 billion in congressional spending on artificial intelligence over the next three years to “harness the opportunities and address the risks” associated with the technology. We see this as another potential tailwind for MSFT shares. We also see Microsoft’s PC and tablet business benefitting from the looming AI-on-device upgrade cycle.
1-Wk. Price Change: 2.1%; Yield: 0.7%
INVESTMENT THESIS: We believe the cloud to be a secular growth trend and that upside to the shares will result from Microsoft's hybrid cloud leadership as the company grabs market share in this expanding industry. While companies may look to build out multi-cloud environments, Microsoft's Azure offering will be a prime choice thanks to its decision to provide the same "stack" used in the public cloud, to companies for their on-premises data centers. Additionally, we would note that hybrid environments are currently the preference for most companies because they allow them to maintain critical data in-house while taking advantage of the agility and scalability provided by public clouds. Outside of the cloud opportunity, we maintain a positive view on the company's growing gaming business, which we believe is becoming an increasingly prominent factor in the Microsoft growth story as gaming becomes more mainstream, management works to convert its gaming revenue from one-time license purchase to a recurring subscription model and as technologies like augmented/virtual reality evolve. Finally, as it relates to LinkedIn and other subscription-based services such as O365 and various Dynamics products, we continue to value them highly for their recurring revenue streams, which, we remind members, provide for greater transparency of future earnings.
Target Price: $480; Rating: Two
Panic Point: Reiterate $350
RISKS: Slowdown in IT spending, competition, cannibalization of on-premises business by the cloud.
Morgan Stanley MS ; $97.14; 1,575 shares; 3.51%; Sector: Financial Services
WEEKLY UPDATE: The pace of new M&A deals continued this week, including the one accounted for by our own Waste Management for Stericycle. The latest EY Pantheon Deal Barometer forecasts that 2024 U.S. corporate M&A deal volume will increase by 20% this year and U.S. private equity M&A deal volume will be up 16%. EY sees that strength continuing into 2025 because its EY CEO Outlook survey points to an increase in CEOs looking to make acquisitions and a big rise in those looking to divest assets. We are also seeing the IPO market continue to firm in the U.S. and we are starting to see signs of a rebound in the European IPO market following a two-year pause. IPO pipelines continue to grow, and recent IPO performance suggests the offering window should remain open. As we see more transactions announced and price, we’ll revisit our $105 target for MS shares. We would also note Morgan’s last dividend payment of $0.85 per share was its fourth at that level, which means we could learn of another dividend increase by mid-July. That could be another reason for us to nudge our price target higher.
1-Wk. Price Change: -0.7%; Yield: 3.5%
INVESTMENT THESIS: Morgan Stanley reports in three business segments: Institutional Securities (42% of trailing 12-month revenue, 38% of trailing 12-month Income Before Tax), Wealth Management (48%, 55%) and Investment Management (10%, 6%). While the IPO window has yet to reopen, the potential IPO class for 2024 continues to build with recent additions including Panera Bread, Reddit, Fanatics, and Skims, which is backed by Kim Kardashian. This along with the Fed increasingly likely to start cutting rates in H1 2024, suggests we are far closer to the IPO window opening on a sustained basis than we have been in some time. That would be a boon to private equity firms and others that have been nursing IPO candidates during the dark period and a positive for Morgan's investment banking business. Marginally lower rates could also generate a pick-up in M&A activity as the cost of capital with rates improving. As the Fed continues its cutting cycle to get rates back to normalized levels, that effort would also reduce rates for stock market alternatives, ones that quashed the "there is no alternative" trade earlier this year. That along with folks continuing to be behind in retirement savings bodes well for Morgan's wealth management business in the coming quarters.
Target Price: $105; Rating Two
Panic Point: $83
RISKS: Market and interest rate risk, credit risk, country risk, and operational risk, including cybersecurity.
PepsiCo Inc. PEP; $171.04; 800 shares; 3.14%; Sector: Consumer Defensive
WEEKLY UPDATE: After rising sharply to a mid-May high Pepsi stock has fallen hard and is back in a trading range. The steep 7% drop saw Pepsi test the 100-day moving average, which is right near the 200-day moving average. We could be in this range of $165-$182 until the company issues its next quarterly earnings report in mid-July. During the week Dr Pepper (KDP) announced they had overtaken Pepsi to become America’s second favorite soda behind Coke. While many would consider this a setback, we have to remember PepsiCo's diversification into other beverage categories mitigates any real damage. Also, remember that PepsiCo’s snack business is not only a higher margin one but one that generates more than half of its operating profit. With consumers continuing to shift their dining dollars back home, should we see PEP shares move toward the lower end of the trading range outlined above, it would give us a reason to add more to the portfolio. PepsiCo’s new quarterly dividend of $1.355 per share, a 7% increase, will be paid on June 28 to shareholders of record on June 7. This marks the 52nd consecutive annual dividend increase for this Dividend King, a sure sign, in our book, of a high-quality company.
1-Wk. Price Change: -1.1%; Yield: 3.2%
INVESTMENT THESIS: PepsiCo is one of the largest food-and-beverage companies globally. It makes, markets, and sells a slew of brands across the beverage and snack categories, including Pepsi, Mountain Dew, Gatorade, Doritos, Lays, and Ruffles. The firm uses a largely integrated go-to-market model, though it does leverage third-party bottlers, contract manufacturers, and distributors in certain markets. In addition to company-owned trademarks, Pepsi manufactures and distributes other brands through partnerships and joint ventures with companies such as Starbucks. The combination of the consumable nature of those products along with PepsiCo's ability to realize price increases has led to consistent revenue, EPS, and dividend growth during both the Great Recession and the Covid pandemic.
Target Price: Reiterate $185; Rating: Two
Panic Point: $145
RISKS: Economic conditions, supply chain constraints, raw material costs.
Qualcomm Inc. QCOM ; $206.62; 855 shares; 4.05%; Sector: Technology
WEEKLY UPDATE: Quarter-to-date QCOM shares have been a champ for the portfolio, so much so that prudent portfolio management led us to ring the register on those gains early in the week. Even after the trade we kept a sizable QCOM position to capture the benefit of the coming AI PC and AI-enabled smartphone upgrade cycle. During the week, technology solutions company Connection (CNXN) announced it was working with Microsoft, Qualcomm, and other leading OEM partners to launch Copilot+ PCs. On Friday, the monster May revenue reported by Taiwan Semiconductor led us to boost our QCOM price target to $240 from $230. The next catalyst to watch for QCOM shares will be Apple’s WWDC keynote on Monday, June 10, which should showcase Apple’s AI efforts and in turn help us wrap our arms around the AI-on-device upgrade cycle.
1-Wk. Price Change: 1.3%; Yield: 1.6%
INVESTMENT THESIS: Qualcomm focuses on foundational technologies for the wireless industry, including 3G (third generation), 4G (fourth generation), and 5G (fifth generation) wireless technologies and processor technologies including high-performance, low-power computing, and on-device artificial intelligence technologies. As a connected processor company, its technology roadmap aims to enable the connected intelligent edge (the next generation of smart devices) across industries and applications beyond handsets, including automotive and the Internet of Things (IoT). Qualcomm has three reportable segments: QCT (Qualcomm CDMA Technologies) semiconductor business, which develops and supplies integrated circuits and system software based on 3G/4G/5G and other technologies for use in mobile devices; automotive systems for connectivity, digital cockpit, and ADAS/AD; and IoT including consumer electronic devices; industrial devices; and edge networking products. QCT accounts for 80%-85% of revenue. QTL (Qualcomm Technology Licensing) licensing business grants licenses or otherwise provides rights to use portions of the company's intellectual property portfolio, which includes certain patent rights essential to and/or useful in the manufacture and sale of certain wireless products. QTL accounts for ~15% of Qualcomm's revenue but contributes a greater portion of the company's operating income.
Target Price: $240; Rating Two
Panic Point: $175
RISKS: Customer risk, technology advancement, competition risk, third-party supplier, and manufacturing partner risk.
SPDR Gold Shares ETF GLD ; $211.63; 238 shares; 1.15%; Sector: Commodities
WEEKLY UPDATE: Gold had been on the rise this week but got whacked on Friday, falling at one point about 2%. Inflation is still on the rise with higher hourly earnings outpacing expectations in the May jobs report alongside a large jobs print for the month. Gold’s interest has been well-known as central banks are purchasing the metal. We still hold the GLD shares due to the uncertainties in the world in the Middle East and the Ukraine/Russia conflict. The chart shows good support at the 50-day moving average, which was tested this past week and held. Below there is some support at the $212 level. GLD is not oversold here and remains in what can be called a "no man's land," an area that is not attractive to buy or sell. That may change soon enough, if the metal declines more that will set up another buying opportunity.
1-Wk. Price Change: -1.7%; Yield: 0.0%
INVESTMENT THESIS: The GLD ETF is a proxy for gold. This "trust" buys and sells gold futures each day to mimic the daily moves in the underlying asset, in this case, gold. We see gold as an ideal hedge against a weaker dollar, strong inflation (which tends to weaken the dollar) alternative, and in uncertain times (worry over war and battles). For the past 15 years, gold has been a strong asset class held by fund managers, countries, and banks. The metal is not correlated with markets and will move based on the demand/supply dynamic in the marketplace. Other precious metals such as silver and platinum are good proxies for the criteria stated earlier, however, gold is far more liquid and offers better upside opportunities.
Target Price: Reiterate $230; Rating: Two
Panic Point: $190
RISKS: Weak inflation data, interest rate risk, dollar strength relative to other currencies, geographic risk.
ServiceNow NOW ; $698.81; 66 shares; 1.06%; Sector: Technology
WEEKLY UPDATE: We initiated a starter position in ServiceNow establishing a price target of $840 and a panic point of $585. We are in the early innings of enterprises, universities, and governments adopting AI, and our intent is to build out the portfolio’s position in NOW shares ahead of that adoption curve.
1-Wk. Price Change: 5.5%; Yield: 0.0%
INVESTMENT THESIS: The addition of ServiceNow adds exposure to the enterprise as it deploys AI-enabled solutions across its enterprise workflow platform. The company’s “Now Platform” is a cloud-based solution with embedded AI and machine learning (ML) capabilities that help unify and digitize workflows, driving productivity. At the heart of it, the company’s platform automates workflows across an entire enterprise by connecting disparate departments, systems, and silos in a seamless way to unlock productivity. ServiceNow counts more than 8,100 global customers, including 85% of the Fortune 500, with 97% of its revenue from subscriptions that have notched a 98% renewal rate.
Target Price: Reiterate $840; Rating: Two
Panic Point: $585
RISKS: Industry and economic risk, competition and competitive pressures, and acquisition risk.
Waste Management WM ; $200.55; 530 shares; 2.44%; Sector: Industrials
WEEKLY UPDATE: Early in the week, Waste Management WM announced it will acquire medical waste company Stericycle (SRCL) for $62 per share, roughly $7.2 billion in total when we include the company’s $1.4 billion of net debt. We’re not surprised to see WM shares trade off in reaction, but with the benefit of some hindsight, this transaction explains why we heard Waste was exploring the $3 billion sale of its renewable natural gas (RNG) business. Near-term Waste will finance the transaction, but we would not be surprised to see an eventual sale of the RNG business as Waste targets net debt to EBITDA of 2.75x to 3.0x in the next 18 months. In our view, Stericycle fits well with Waste’s core business and brings a layer of growth to it. We are likely to see some adjustments in top- and bottom-line expectations for Waste in the coming days, with revenue rising to factor in the $2.7 billion to $2.8 billion that Stericycle was expected to generate this year and next. In the near term, we are also likely to see some modest margin dilution given the difference between Waste’s operating margin of 20% to 21% and Stericycle’s low-teens margins. We will plan to let the market absorb the acquisition news, let the top- and bottom-line expectations see revisions and then we’ll look to pick up some additional WM shares.
1-Wk. Price Change: -4.8%; Yield: 1.5%
INVESTMENT THESIS: 2024 will see more nonresidential construction activity because of the Biden Infrastructure Law, but now we can finally factor in activity for the CHIPS Act, which saw its first award this week. Other potential drivers include spending associated with the Inflation Reduction Act, including the much-awaited start of building out a nationwide network of EV charging stations. Recently President Biden announced an $8.2 billion passenger rail project, which will likely take several quarters to come onstream, leading us to think it's more of a 2025 catalyst. Alongside that bright outlook for WM's commercial business, automation efforts and pricing power in its sticky residential business should drive margins and EPS generation higher in the coming quarters.
Target Price: Reiterate $230; Rating: Two
Panic Point: $178
RISKS: Industry and economic risk, competition and competitive pressures, and acquisition risk.
