Chart of the Day: Mastercard May Be Telling Us Something
Is the chart here giving us a read on more than the technicals?
You've reached your free article limit
You've read 0 of 1 free Pro articles.
Mastercard's MA, stock chart is certainly challenged.
The company has a finger on the pulse of the consumer and hence the economy— and its chart is saying indirectly that the consumer is slowing down. How many times have economists/strategists called for the death of consumer spending? Many times of course, and they have always been wrong.
Is this time different, if Mastercard is telling us to be cautious (based on the stock action)?
The price action is not bullish, with lower highs and lower lows on this daily chart, and the resistance line is in place.
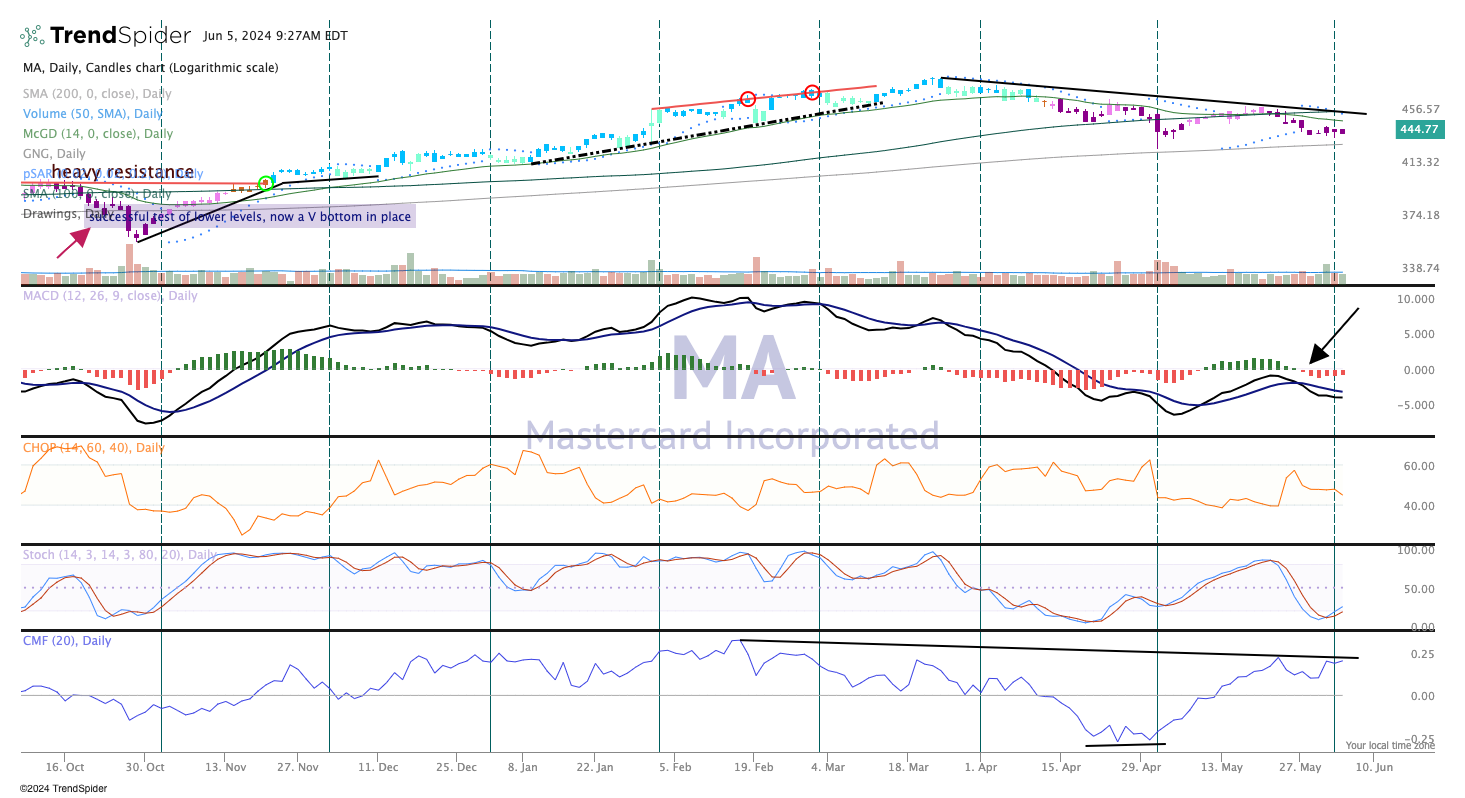
The indicators we follow are mostly bearish. The Moving Average Convergence Divergence (MACD) is on a sell signal that was recently re-inforced (arrow in pane 2).
Parabolic SAR (stop and reverse) is bearish (top pane). Notice the change in color of the candles in the top pane; from March to June Mastercard went from blue to teal to pink to purple. Basically, that is bullish to bearish.
Let's see if this recent low in the $440s holds firm. If so maybe a move towards $500. For now, we'll keep our eye on this name, which we rate Two in TheStreet Pro portfolio, meaning "stockpile on pullbacks."
More Pro Portfolio:
- We're Initiating a New Tech Position
- Weekly Roundup: How We Benefited From the Market Divergence
- Signals From Our Investing Notebook
At the time of publication, TheStreet Pro Portfolio was long MA.
