Charting the S&P 500: After Strong Finish to May, What's in Store for June?
May turned the tables on a weak April and now some momentum is present leading into the new month.
You've reached your free article limit
You've read 0 of 1 free Pro articles.
That was some finish for the S&P 500 for the month of May. Of course, much of that work was accomplished during the last 90 minutes of trading, but when you're caught "napping" that is often what happens.
Some very heavy buy programs triggered at the end of Friday and pulled the indexes higher. Volatility declined as well, more than 10%, which also triggered an avalanche of buying. The more than 70-handle turn in the S&P 500 left the week with another blue candle, with the overall market remaining bullish for the intermediate and long term.
For the week, the S&P 500 finished at it's highest point, which on a Friday meant that buyers simply wouldn't let go of stocks in front of a weekend. That is a very bullish sentiment indicator (as weekends are often filled with uncertainty).
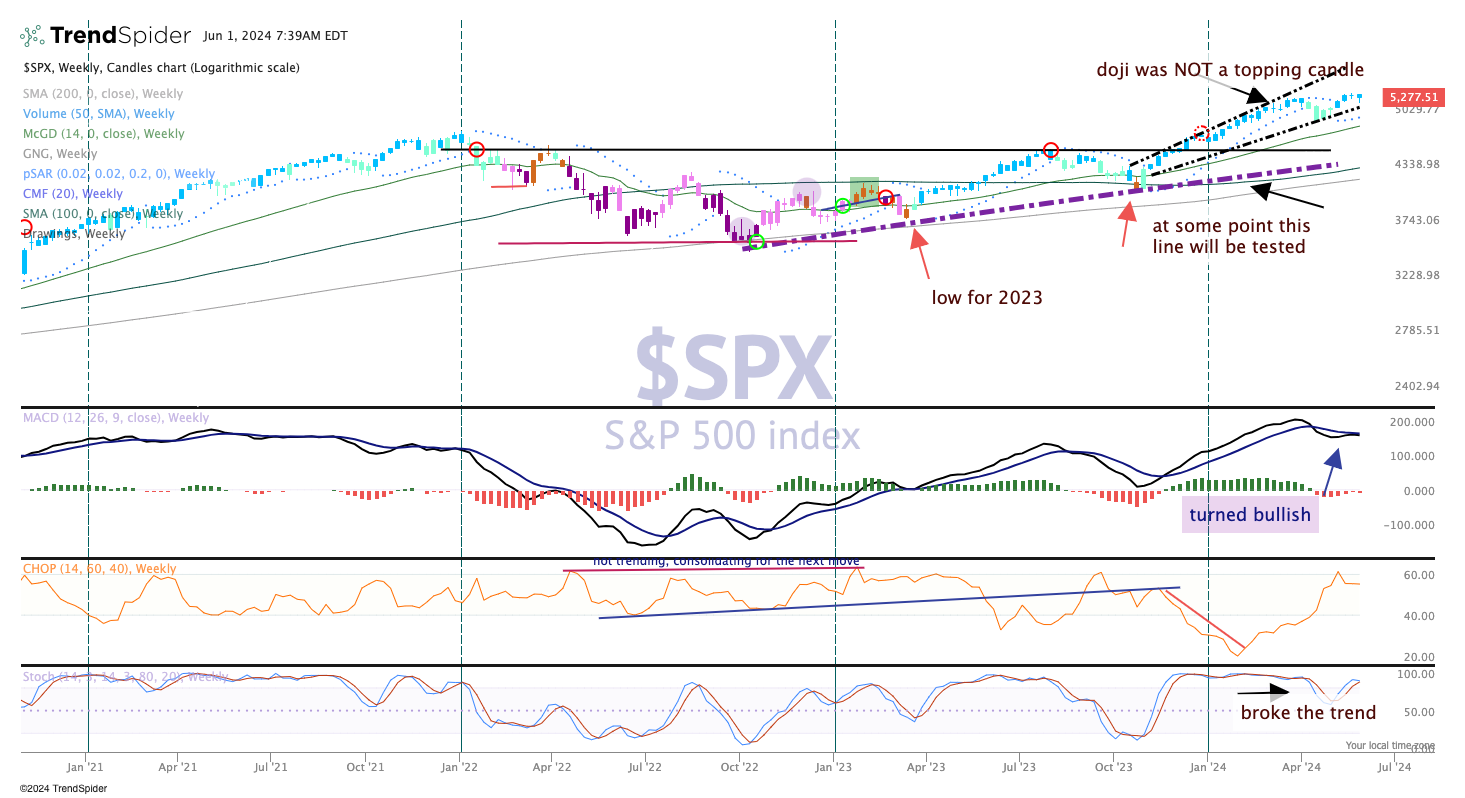
Moving Average Convergence Divergence (MACD), which we stated recently would turn bullish, has now been complete. This signal could last awhile longer. Stochastics (bottom pane) remain bullish as well, while the parabolic SAR (stop and reverse) in the top pane is also bullish.
The '500 is right near an all-time high, about 1.5% away. That could now be chipped away as soon as this week.
