Chart of the Day: Vulcan Materials Looks Set to Test Major Support
The 200-day moving average is just below the current price.
You've reached your free article limit
You've read 0 of 1 free Pro articles.
The chart of Vulcan Materials VMC shows the stock is in a much-needed corrective phase. We say "much-needed" because a stock such as this industrial needs a period of digestion after pushing to new highs.
Remember the months of February and March, with the stock going up day after day? Yep, those days are gone now, and the mirror image of the uptrend is now in place. But do we see Vulcan breaking down much further? Not really, and actually the 200-day moving average is not far away from current levels, where if it lands there should provide some excellent support and buying from big institutions.
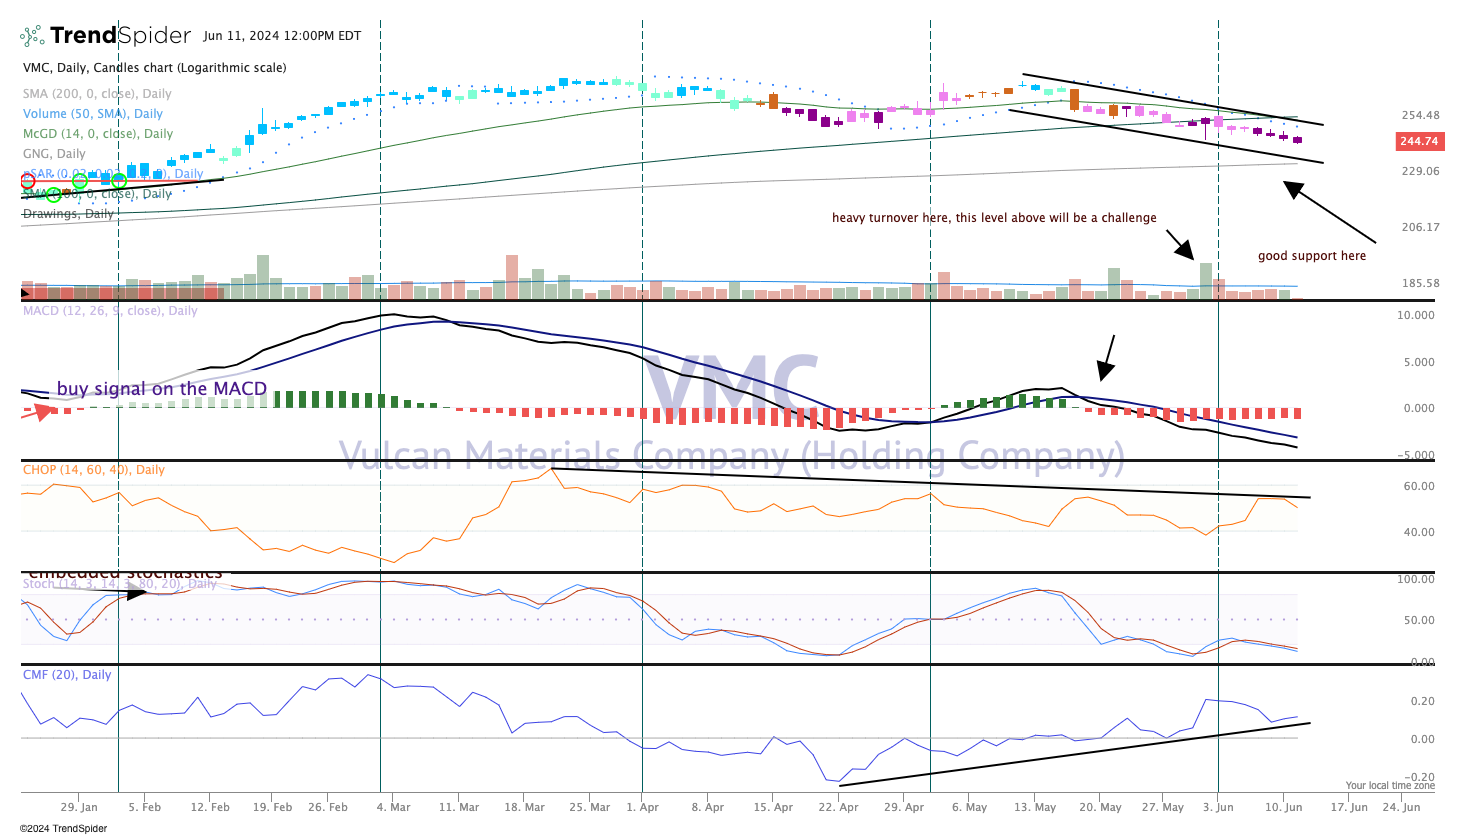
The indicators are not telling us a clear story though. The Moving Average Convergence Divergence (MACD) is bearish while volume trends are neutral. Money flow is showing a nice upward slope, which is bullish. However, stochastics (pane 4) are down and have not turned up, so momentum is absent.
A stop soon in price drops at the 200-day moving average or sooner would be an ideal spot to add more shares.
We rate Vulcan Materials a One in TheStreet Pro portfolio.
More Pro Portfolio:
- We're Locking in a Slice of Big Gains in These 3 Holdings
- Weekly Roundup: 5 Stocks Power the Portfolio
- Signals From Our Investing Notebook
At the time of publication, TheStreet Pro Portfolio was long VMC.
