Monthly Roundup: Portfolio Sees Green in October Amid a Red Month for the Market
We came into October looking for opportunities and we found several.
You've reached your free article limit
You've read 0 of 1 free Pro articles.
This week we closed out the month of October with an array of quarterly results that pulled the rug out from all the major market indexes, leaving them to finish the month in the red. Coming into October, several factors, ranging from the S&P 500’s stretched valuation, to a more vibrant than expected economy, to an elevated investor sentiment, kept us on a cautious path.
That led us to adopt a market-hedging position in the ProShares Short S&P500 ETF SH, which served us especially well during the final days of October when Big Tech companies moved lower following their latest quarterly results. We were opportunistic as well, taking advantage of pronounced moves in several holdings, picking our spots to add more shares when it made sense.
Next week brings the presidential election, the Fed’s next policy meeting, and another round of September-quarter earnings. We would not be surprised if we don't see a clear winner declared on election night. Indeed, it could be a day or two until we know the result. As the dust settles, we’ll have a better idea of the policy path forward as well as the fate of the 2017 tax cuts. Friday’s October Employment Report lifts the odds of a Fed rate cut next week, but the Fed's comments about the pace of future rate cuts will be as important. Even though we are entering the seasonally strongest time of the year, those events suggest taking a measured approach next week.
Seventy percent of the S&P 500 has reported, and 75% of those that have, have delivered a positive bottom-line surprise. However, those results and factoring in updated guidance led to another modest decline in H2 EPS growth expectations for the S&P 500 to 6.5% compared to H1 2024. Even after that revision and the October move lower, the S&P 500 is still trading at nearly 24x expected 2024 EPS near $240 and almost 21x expected 2025 EPS of $274.81. That provides context for our cautious footing and the need to capitalize on opportunities when they presented themselves like they did this past week.
With the portfolio’s year-to-date return moving further ahead of the S&P 500, we will stick to the strategies that have allowed it to do so. We’ll continue to focus on companies benefiting from pronounced tailwinds that are poised to deliver superior earnings growth. We’ll look for pick-up points that skew favorably on the risk-to-reward continuum. And we will continue to let the data talk to us, lest we make a common investor mistake of reading what we want to see in the data.
While some investors may be focused on the next two months and what that means for 2024, we will continue to focus on the next several quarters, re-positioning the portfolio as needed as fresh data and developments warrant.
Why?
Success, as many have said before, breeds complacency, and complacency can be an obstacle that gives rise to failure. That’s especially true when it comes to the dynamic and ever-changing animal that is the stock market.
Let’s get to work with this edition of the Monthly Roundup.
Catching Up on the Portfolio This Week
While all the major market indexes declined in October, the portfolio gained additional ground during the month. The overall return was weighed down by the sharp move lower in tech stocks late in the month, but meaningful gains in Marvell MRVL, Morgan Stanley MS, Trade Desk TTD, Nvidia NVDA, Vulcan Materials VMC, and Axon Enterprise AXON fueled the portfolio’s outperformance. Meanwhile, Amazon’s AMZN robust quarterly results and improving profit picture as well as its comments that telegraphed nice demand for Marvell started us off on the right foot for November.
Even though the September-quarter earnings season made for a busy set of weeks, during October we executed more than a few actions with the portfolio. This included adding a defensive position with ProShares Short S&P 500 ETF (SH), starting a new one in Elastic N.V. ESTC, and closing out our exposure to Elevance Health ELV following disappointing quarterly results. We used the proceeds from the ELV sales to pick up more shares of Applied Materials AMAT and Elastic. Late in October, as the pace of quarterly earnings approached a zenith, we made several other moves, including adding more shares of Meta META and Eaton ETN. Following the October Employment Report, we shed the portfolio’s market hedging position in SH, which was a net positive for the portfolio in October, and scooped up more shares of Universal Display OLED.
Over the last few weeks, we also rang the register not once but twice with Axon shares, locking in triple-digit gains on those slices. Mid-month, we also locked in some big gains as part of some prudent portfolio management with our shares of Marvell and Morgan Stanley. Turning to Lockheed Martin LMT, early in October we took some very profitable chips off the table near just over $608, but bought them back first near $578 and then again near $547.50 when the shares became oversold.
The culmination of those moves put the portfolio at 28 active positions entering November with roughly 11% of the portfolio’s assets in cash. We will also continue to keep a close watch on Nvidia shares, which are not far away from requiring some prudent portfolio management should their recent strength continue. Based on capital spending comments from Big Tech companies this week, that could happen sooner rather than later, especially if Taiwan Semi (TSM) delivers another robust revenue report.
Our focus on companies positioned to benefit from demonstrative tailwinds and poised to deliver outsized EPS growth will remain in place as we barrel toward the end of 2024 and get ready for the coming year. Hand in hand with that we’ll remain disciplined investors, which means avoiding pitfalls as much as it does capitalizing on winning positions. That combination served us well in Q3 2024 and again in October as the portfolio’s gains outpaced the S&P 500 and its move lower. Much like the character John “Hannibal” Smith on the 1980s TV show The A-Team, we do like it when a plan comes together, but we know there is still much work to be done given the road that lies ahead.
When we return from the weekend and share an updated table of consensus EPS expectations for our holdings, we’ll provide an updated set of panic points and potential entry points as well.
This Week's Portfolio Videos
We cover a lot of ground during the week in our Daily Rundowns. If you happened to miss one or more of them, here are some helpful links:
Monday, October 28: Our Game Plan for Big Tech Earnings and October Jobs Data
Tuesday, October 29: Why We're Staying on the Sidelines for This Construction Holding
Wednesday, October 30: TheStreet Pro’s Live Quarterly Meeting
Key Global Economic Readings
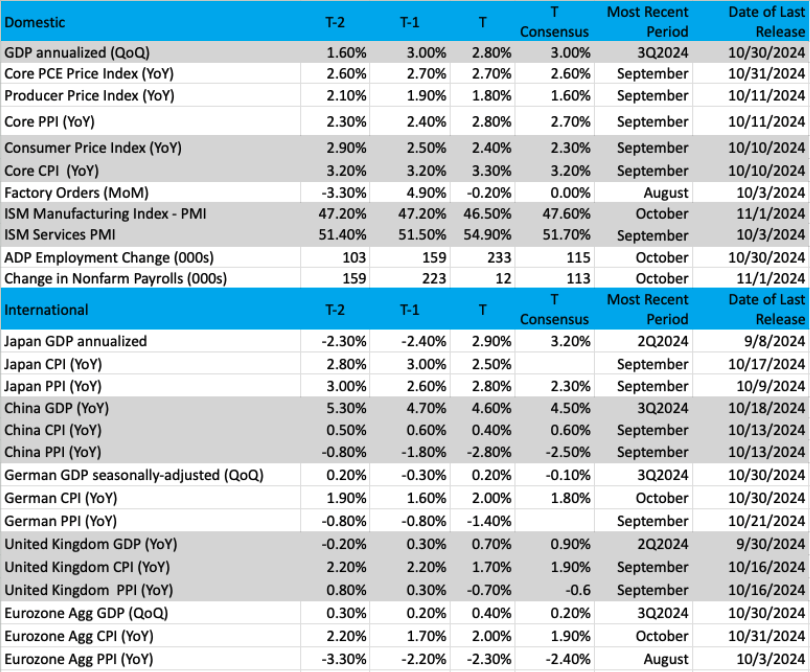
(Note: T is the most recent period, T-1 is the prior period's reading and T-2 is two periods back, the intent being to illustrate any trends)
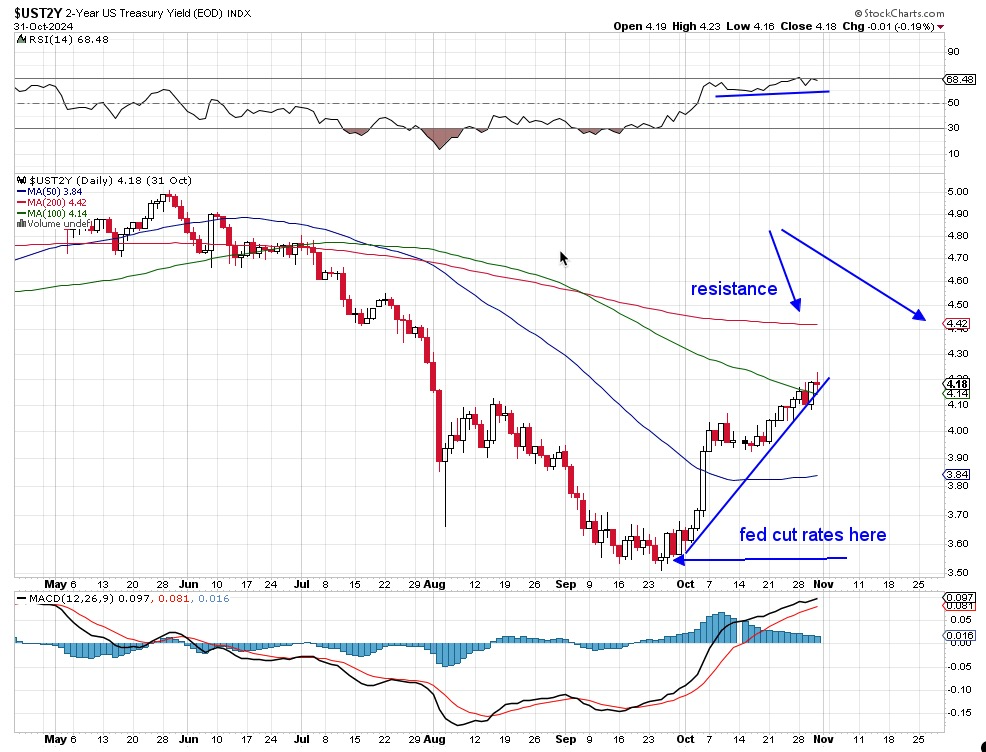
Chart of the Week: Two-Year U.S. Treasury Yield
Is the bond market that important to equity investors? It certainly depends upon who you ask, their time horizon, and their risk profile. But what matters to the equity investor? There are different maturities based on time risk, but is there one out there that tells us more about inflation and the economy? Yes, there is, and it is the 2-year Treasury yield. This return is an excellent proxy for telling investors where inflation is likely to stand in two years.
Now, you may ask, why pick 2-year yields? It’s a good question. The Treasury sells various maturities to dealers and hence the public. The 2-year bond is one of the most popular because it is not long-term (like the 5 or 10) and not short-term (which can be quite volatile).
The Federal Reserve looks closely at the 2-year yield to figure out where inflation expectations are at currently, and this helps them craft monetary policy. When the yield rises, the market is seeing inflation rising, too. The elasticity of the 2-year yield (the ability to move around but come back towards the moving averages) makes for a challenge to time the market properly, but it is still a good proxy given the amount of time involved (24 months).
The chart also gives us some good information about the yield, where it is, and where it might be headed. Notice the low in yield on this chart at nearly 3.55%, a time when the Federal Reserve Open Market Committee (FOMC) decided to slash rates by 50 basis points. That was a bold move, and while the market initially was happy about it the 2-year bond investor was not, and hence started selling these bonds, letting yield rise (remember, yields rise when bond prices go down).
Since early October the 2-year yield has been on the rise, and it is near 4.18%, which is only 57 bps below the Fed funds rate (4.75 currently). That is close. We often see these two yields separated by a significantly higher level (like 100-150bps). The chart shows strength in the yield with a continuous rise likely. However, 4.42% is good resistance (200-day moving average). If bond sellers continue to shed this bond we could see that level within weeks, but if the selling dries up, we could see yields head back down quickly. Relative strength is very good (top pane), which tells us the bond sellers continue to shed fixed income.
Other charts we shared with you this week were:
Monday, October 28: S&P 500 – Volatility Controls the Action for Now
Monday, October 28: Trade Desk (TTD) - This Tech Holding Is Ready to Break Out
Tuesday, October 29: Alphabet (GOOGL) - Here's How Alphabet Looks Ahead of Earnings
Wednesday, October 30: Microsoft (MSFT) - Microsoft Is Springing Forward Ahead of Earnings
Thursday, October 31: Amazon (AMZN) - Amazon Is Going to Move After Earnings, But Which Way Is It Leaning?
The Week Ahead
Coming off several big pieces of economic data, including the first look at Q3 2024 GDP, the September PCE Price Index, ISM’s October Manufacturing PMI, and the October Employment Report, one might hope we have a slower pace next week. that Sorry, that will not be the case, not because of October Service PMIs that will provide a big update on the economy, but rather because of Election Day and the Fed’s November policy meeting.
With the election running extremely close and because of early vote counting, we recognize a clear winner may not be announced Tuesday night or even Wednesday. As the winner is named and we have a better sense of the congressional landscape we’ll start to contemplate potential changes for the policy landscape, tax rates, and other items that could impact the market, the domestic economy, and our holdings.
If you took a peek at next week’s calendar then you may have noticed the Fed’s policy meeting and Fed Chair Powell’s presser will be break from the usual Wednesday, and be held on Thursday. Based on the confounding data we saw in the October Employment Report about the number of jobs added during the month, it gives the Fed enough cover fire to deliver the expected 25-basis point rate cut. We will be closely parsing the Fed’s policy statement and Fed Chair Powell’s comments about the path ahead for future rate cuts.
While we expect the Fed will reiterate its making decisions meeting by meeting and remaining data-dependent, if it delivers a 25-basis point cut next week we could see the central bank telegraph a more measured cadence. Should the Fed’s comments be more dovish than expected, it would give us room to revisit some of our construction-related portfolio holdings.
Here's a closer look at the economic data coming at us next week:
U.S.
Monday, November 4· Factory Orders – September (10:00 AM ET)
Tuesday, November 5
· Election Day· S&P Global Final Services PMI – October (9:45 AM ET)
· ISM Services PMI – October (10:00 AM ET)
Wednesday, November 6
· MBA Mortgage Applications Index – Weekly (7:00 AM ET)
· EIA Crude Oil Inventories – Weekly (10:30 AM ET)
Thursday, November 7
· Initial & Continuing Jobless Claims – Weekly (8:30 AM ET)
· Productivity & Unit Labor Cost – 3Q 2024 (8:30 AM ET)
· EIA Natural Gas Inventories – Weekly (10:30 AM ET)
· Federal Reserve FOMC Rate Decision (2 PM ET)
· Consumer Credit – September (3 PM ET)
Friday, November 8
· The University of Michigan Consumer Sentiment Survey (Prelim) – November (10:00 AM ET)
International
Monday, November 4
· Eurozone: HCOB Manufacturing PMI - October
Tuesday, November 5
· China: Caixin Services PMI – October
· UK: S&P Global Final Services PMI - October
Wednesday, November 6
· Eurozone: HCOB Final Services PMI – October
· Eurozone: Producer Price Index - September
Thursday, November 7
· China: Imports/Exports – October
· Germany: Industrial Production – September
· Eurozone: Retail Sales – September
· UK: Bank of England Interest Rate Decision
Friday, November 8
· Japan: Leading Economic Index (Prelim) - September
While the pace of quarterly earnings will remain brisk next week, the number of results from portfolio holdings is almost cut in half to five positions – Builders FirstSource, Dutch Bros, Qualcomm, Axon, and Trade Desk. That lighter load will afford us more time to scan earnings reports and conference call transcripts from other companies reporting. It will also allow us to cross-reference comments and data points with companies that reported in the last few weeks. Ones that will be on our radar screen next week include NXP Semiconductor (NXPI), Palantir (PLTR), GlobalFoundries (GFS), LGI Homes (LGIH), and Arm Holdings (ARM).
As it relates to Arm, we will be interested in its end-market comments but also what it may say about its entanglement with portfolio-holding Qualcomm. Ahead of the December court case, we suspect Arm as well as Qualcomm will stick to their script when they report next week. We continue to think, however, that a likely outcome will be a renegotiated license between the two companies.
Here's a closer look at the earnings reports coming at us next week:
Monday, November 4
· Open: Constellation Energy (CEG), Marriott (MAR), Yum China! (YUMC).
· Close: Boise Cascade (BCC), Bright Horizons (HFAM), Cirrus Logic (CRUS), Hologic (HOLX), NXP Semiconductor (NXPI), Palantir (PLTR).
Tuesday, November 5
· Open: Builders FirstSource (BLDR), Cummins (CMI), DuPont (DD), Emerson (EMR), Globalfoundries (GFS), LGI Homes (LGIH), TopBuild (BLD).
· Close: International Flavors (IFF), Lumen Technologies (LUMN).
Wednesday, November 6
· Open: American Electric (AEP), Kennametal (KMT), Shopify (SHOP).
· Close: Arm Holdings (ARM), Coherent (COHR), Dutch Bros (BROS), Lyft (LYFT), Qualcomm (QCOM), Tanger Factory (SKT), Veeco Instruments (VECO), Zillow (ZG).
Thursday, November 7
· Open: Air Products (APD), Ceva (CEVA), GoodRX (GDRX), Hershey Foods (HSY), Installed Building Products (IBP), Ralph Lauren (RL), Tapestry (TPR).
· Close: Airbnb (ABNB), Alarm.com (ALRM), AMN Healthcare (AMN), Axon (AXON), Block (SQ), Fortinet (FTNT), indie Semiconductor (INDI), Insulet (PODD), Motorola Solutions (MSI), Synaptics (SYNA), Trade Desk (TTD).
Friday, November 8
· Open: Advanced Drainage Systems (WMS), CNH Industrial (CNHI), Lamar Advertising (LAMR), Sony (SONY).
Portfolio Investor Resource Guide
· Economic Data: Here's a List of Links to the Key Economic Data We Closely Watch
· Investing Terminology: 16 Key Terms Club Members Should Know
· 10-Ks: Want to Know About a Stock? Read the Company's Reports
· 10-Qs: Unlock the Numbers and Key Information Behind Your Stock With the 10-Q
· Income Statement: Our Cheat Sheet to Understanding This Financial Document
· Balance Sheet, Cash Flow Statements, and Dividends: How to Know If a Company Is Off-Kilter? Read Its Balance Sheet
· Valuation Metrics: Everyone Wants a Value. Here's How Investors Can Find
The Portfolio Ratings System
1 - Buy Now (BN): Stocks that look compelling to buy right now.
2 - Stockpile (SP): Positions we would add to on pullbacks or a successful test of technical support levels.
3 - Holding Pattern (HP): Stocks we are holding as we wait for a fresh catalyst to make our next move.
4 - Sell (S): Positions we intend to exit.
ONES
Alphabet GOOGL; $171.29; 1,035 shares; 3.72%; Sector: Communication Services
UPDATE: Shares of Alphabet GOOGL were rangebound for most of October but that changed following the company’s across-the-board better-than-expected September-quarter earnings report this week. While we maintained our $210 price target, Seaport Research upgraded GOOGL shares to Buy from Neutral with a $200 price target, and others, including KeyBanc, Oppenheimer, Evercore ISI, and BofA, raised their price targets to levels that bookended ours. The reason for no change to our price target reflects the prospects for modest margin expansion near term as the company continues to invest in AI, lower-margin Google Cloud becomes a piece of the revenue pie, and Google Advertising revenue growth slows following the 2024 presidential election. Because we are still in the relatively early innings when it comes to AI revenue generation, we will be patient with Alphabet and GOOGL shares. We continue to see the company well positioned, given its treasure trove of data across its search, advertising, and YouTube businesses, which should benefit the company in the coming months with an upswing in digital advertising. As AI matures, we see it bringing further lift to Google Cloud’s revenue and profit generation. During the quarter, Alphabet repurchased $15.3 billion in stock, bringing its year-to-date total to $47 billion, leaving nearly $60 billion left under its current buyback program. The company’s next quarterly dividend of $0.20 per share will be paid on December 16 to shareholders of record on December 9.
1-Wk. Price Change: 3.6%; Yield: 0.5%
INVESTMENT THESIS: We believe that while search and digital ad dominance are what will carry shares in the near- to mid-term, longer-term it is the company's artificial intelligence "moat" that will provide for new avenues of growth. AI is what has made the company's search, video, and targeted ad capabilities best-in-class and is the driving force behind the company's success in voice (Google Home) and autonomous driving (Waymo). Furthermore, we believe it is this AI expertise that will also make the company more prevalent in other industries, including healthcare via its subsidiary Verily, as AI and machine learning continue to disrupt operations across industries. Adding to our positive view of the company's future opportunities, we believe that Alphabet's free cash flow generation and solid balance sheet set it apart and are what will allow the company to continue taking chances on far-out ground-breaking and potentially world-changing projects. The company is also preparing to roll out Gemini Subscription with enterprise plans for workspace, according to a report. All good news for Alphabet.
Target Price: Reiterate $210; Rating: One
Panic Point: $145
RISKS: Regulatory risk (data privacy), competition, and macroeconomic slowdown impacting consumers and therefore ad buyer activity.
Amazon AMZN; $197.93; 946 shares; 3.93%; Sector: Consumer Discretionary
UPDATE: Following their last September swoon, Amazon (AMZN) shares trended lower early in October but clawed that back to finish the month unchanged. Following the company’s October 31 earnings report for Q3 2024, the shares jumped as investors celebrated better-than-expected revenue, margins, and EPS. Parsing the company’s results and digesting management comments that point to Amazon recognizing more operating leverage in the coming quarters and its mix shift moving further to favor its higher-margin Amazon Web Services and Advertising businesses, we boosted our AMZN price target to $240 from $220. Holiday shopping forecasts from Deloitte, Adobe (ADBE), and others point to continued share gains by digital shopping this year, setting the stage for strong performance by Amazon. Meanwhile, comments from ServiceNow (NOW), Salesforce (CRM), IBM (IBM), Microsoft (MSFT), and others peak to corporate uptake of AI. That and the continued migration to the cloud sets up Amazon Web Service rather well. Based on the company’s December quarter guidance for $181.5 billion-$188.5 billion in revenue, up 7%-11% year over year, it sees operating income in the range of $16 billion-$20 billion. Some quick math puts the quarter’s operating margin between 9% and 11% compared to 11% in the September quarter. Our take is that view is likely conservative. Looking ahead, the benefit of continued cost efficiencies in its fulfillment network and the mix shift toward the higher margin AWS and advertising businesses bode extremely well for higher margins and profit dollars next year compared to this year. Following Amazon’s wonderful September-quarter earnings report, Telsey Advisory lifted its AMZN target to $235 from $215, TD Cowen upped its to $240 from $230, and Evercore ISI reset its at $260 from $240.
1-Wk. Price Change: 5.4%; Yield: 0.0%
INVESTMENT THESIS: We believe upside will result from Amazon's continued eCommerce dominance, AWS's continued leadership in the public cloud space, and ongoing growth of the company's advertising revenue stream, which feeds off Amazon's eCommerce business. Additionally, we think profitability will continue to improve as AWS and advertising account for a larger portion of total sales as both these segments sport higher margins than the eCommerce operation. While we believe the increasing share of the revenue from these higher margin businesses will be key to driving profitability longer-term, we think margins on eCommerce stand to improve as the company's infrastructure is further built out and economies of scale further kick in. The embedded call option is that management is always looking to enter a new space and generate new revenue streams.
Target Price: Reiterate $240; Rating: One
Panic Point: $148
RISKS: High valuation exposes the stock to volatile swings, eCommerce has exposure to slower consumer spending and competition, management is not afraid to invest heavily, potential headwinds resulting from new eCommerce regulation in India, and management is not scared to invest aggressively for growth, which can at times cause volatile reactions as near-term concerns arise relating to the impact on margins.
Bank of America Corp. BAC; $41.76; 4,675 shares; 4.12%; Sector: Financial Services
UPDATE: Bank of America shares were a nice contributor to the portfolio during October, rising well ahead of the market. We attribute that to the company’s September-quarter earnings report, which showcased our rationale for owning the shares and led us to boost our price target to $51 from $49. We continue to see Bank of America’s investment banking and asset/wealth management businesses well positioned as the Fed delivers incremental interest rate cuts over the ensuing months. BofA is expected to give initial 2025 net interest income (NII) guidance when it reports December-quarter results in January and it could benefit from improving IPO market prospects. BofA’s efforts to expand its commercial banking footprint should pay dividends as those lower rates boost lending activity. Late in October market chatter suggested BofA could be targeted by activist investors, but so far, we have yet to see any further follow-up to that speculation. If we saw BAC shares retreat to support near $40, it would be a very favorable place for members to add BAC shares.
1-Wk. Price Change: -0.3%; Yield: 2.5%
INVESTMENT THESIS: Bank of America is one of the world's leading financial institutions, serving individual consumers, small and middle-market businesses, and large corporations with a full range of banking, investing, asset management, and other financial and risk management products and services. The company provides unmatched convenience in the United States, serving approximately 67 million consumer and small business clients with approximately 3,900 retail financial centers, approximately 16,000 ATMs, and award-winning digital banking with approximately 56 million verified digital users. Bank of America is a global leader in wealth management, corporate and investment banking, and trading across a broad range of asset classes, serving corporations, governments, institutions, and individuals around the world. Bank of America offers industry-leading support to approximately 3 million small business households through a suite of innovative, easy-to-use online products and services. The company serves clients through operations across the United States, its territories, and approximately 35 countries. From a reporting perspective, the company's business breaks down as follows: Net Interest Income breakdown: Consumer Banking 57%, Global Banking 23%, Global Wealth & Investment Management 14%, and Global Markets 6%; Income Before Tax breakdown: Consumer Banking 42%, Global Banking 27%, Global Wealth & Investment Management 16%, and Global Markets 15%. Bank of America pays a quarterly dividend of $0.22 per share.
Target Price: $51; Rating: One
Panic Point: $34
RISKS: Financial markets, fiscal, monetary, and regulatory policies, economic conditions, and credit ratings.
Builders FirstSource BLDR; $172.02; 650 shares; 2.35%; Sector: Industrials
UPDATE: When took on shares of Builders FirstSource (BLDR) in June, our thesis hinged on the Fed eventually embarking on a rate-cutting cycle that would strengthen housing construction. At the same time, homebuilder focus on margins would be a positive for Builder’s value-added products. That line of thinking played out extremely well in July, August, and especially September, leaving BLDR shares up 40% for Q3 2024. Following strong second-half delivery guidance from Lennar (LEN) and KB Home (KBH), we boosted our BLDR price target to $235 from $205. We continue to see Builders and its shares benefiting as the Fed moves further down the rate curve over the coming 12-15 months, setting up what could be a very robust 2026 for housing construction and BLDR shares. However, the strength of the economy has started to soften rate cut expectations and the 10-year Treasury yield rebounded in October, putting it back at levels last seen in late July. That in turn has weighed on BLDR shares. While we have enough upside in the shares relative to our price target to add additional ones to our holdings, we are opting to at least wait until we digest the Fed’s next policy statement on November 7 before making such a move. BLDR will report its quarterly results on November 5 and as the company updates its outlook, we will keep our eyes on key support levels for the shares near $167.
1-Wk. Price Change: -4.9%; Yield: 0.0%
INVESTMENT THESIS: Builders FirstSource is a supplier and manufacturer of building materials, manufactured components, and construction services to professional homebuilders, sub-contractors, remodelers, and consumers. The company’s top 10 customers account for 15% of net sales and are comprised primarily of the largest national production homebuilders, including publicly traded companies such as D.R. Horton, Dream Finders Homes, Lennar Corp., Pulte, Taylor Morrison Home, and Toll Brothers. The company is leveraging its national manufacturing footprint to grow its higher-margin value-added products as homebuilders look for more efficient ways to construct homes. We see this driving faster revenue and earnings growth in the coming quarters as the eventual rate-cutting cycle by the Fed lifts the demand for housing.
Target Price: $235; Rating: One
Panic Point: $160.
RISKS: Economy, interest rates, commodity pricing, and supply chain risks.
Dutch Bros BROS; $33.40; 3,540 shares; 2.48%; Sector: Consumer Cyclical
UPDATE: Following September’s outperformance, shares of Dutch Bros (BROS) were a sleeper hit for the portfolio in October given their double-digit increase that came with no headlines, announcements, changes to consensus EPS figures, or Wall Street price targets. Even the negative pre-announcement from Starbucks (SBUX) did little to shake the climb in BROS shares over the last few weeks. Comments by McDonald’s (MCD) over how it won back customers with its value offering suggest the more affordable Dutch Bros should deliver far better comp sales than the Q3 2024 decline of 6% for Starbucks’ U.S. business. While some may be concerned about consumers being selective, our thinking is that concern is overshadowed by the company’s footprint expansion and more affordable prices. As the Fed moves deeper into its rate-cutting cycle hurdle rates and borrowing costs for new construction projects should improve. Given its cash-rich balance sheet, access to capital, and current footprint, this suggests Dutch Bros could continue to expand at a healthy clip in 2025. When Dutch Bros reports on November 6, we’ll be looking for updated comments for its 2024 and 2025 expansion plans. At that time, we’ll also be revisiting our $39 price target and, as needed, our One rating on the shares.
1-Wk. Price Change: -6.0%; Yield: 0.0%
INVESTMENT THESIS: Dutch Bros is an operator and franchisor of drive-thru shops that focus on serving high-quality, hand-crafted beverages with unparalleled speed and superior service. As of June 30, 2024, there were 912 shops in operation in 18 U.S. states, of which 612 were company-operated and 300 were franchised. Coffee-based beverages make up ~50% of the menu mix, and ~25% of the menu mix is based upon the company’s proprietary Blue Rebel energy drink, which is highly customizable with flavors and modifiers and can be served blended or over ice. The energy platform helps unlock the afternoon daypart and broadens the company’s appeal. The remaining 25% of the menu mix is a wide variety of teas, lemonades, sodas, and smoothies. Through the first half of 2024, Dutch Bros opened 81 shops and targets 150-165 new ones for all of 2024. The company’s west-to-east expansion is a time-tested strategy that should drive revenue and EPS growth over the next several years.
Target Price: Reiterate $39; Rating: One
Panic Point: $27
RISKS: Commodity risks, labor costs, interest rate risk, inflation.
Elastic N.V. ESTC; $80.84; 1,755 shares; 2.98%; Sector: Consumer Cyclical
UPDATE: A third of the way through October, we took advantage of the opportunity created by the pronounced pullback in the Elastic N.V. (ESTC) shares to grow the portfolio’s exposure to enterprise software. Elastic’s customer count has mushroomed to more than 21,200 exiting its July quarter, but even more impressive is its growth in customers with over $100,000 in annual contract value (ACV). The number of those customers reached 1,370 at the end of July, continuing a steady growth rate over the last few years. Paired with similar gains in customers with ACV over $10,000 has led the average subscription revenue per customer to climb to about $16,368 compared to $12,868 exiting its fiscal 2022. Also influencing that decision were survey findings from CapGemini and EY as well as our weekly signals that point to rising AI adoption in the enterprise. While Elastic might land on some M&A radar screens, that is not a reason for our adding ESTC to the portfolio. Still, if the company were to be acquired, the odds of that transaction delivering a nice return for the portfolio are pretty good. Later in October, we used proceeds from the sale of Elevance Health (ELV) to scoop up additional ESTC shares. Entering November, we have room to build the portfolio’s ESTC position further and we will look to do so as more data confirms AI adoption in the enterprise.
1-Wk. Price Change: 1.9%; Yield: 0.0%
INVESTMENT THESIS: As digital transformation drives mission-critical business functions to the cloud, Elastic N.V. brings the portfolio exposure to search AI adoption across IT and enterprise business lines as companies look to drive productivity. Elastic bills itself as the Search AI company and its Elastic Search AI Platform as a hosted, managed service across major cloud providers, including Amazon Web Services (AWS), Google Cloud, and Microsoft’s Azure in more than 55 public cloud regions globally. Customers can also deploy Elastic’s platform across hybrid clouds, public or private clouds, and multi-cloud environments. What we like even more about this is Elastic’s subscription-based business model, which accounts for just over 93% of its total revenue stream. As we’ve discussed before with other companies, this affords not only good visibility but also predictable cash flow and earnings. Moreover, the gross margins associated with the subscription business are above 80%, which helps explain the rising margin profile and EPS as that business has come to account for a greater percentage of overall revenue. When it comes to potential risks, one sign that would lead us to reconsider owning the shares would be if either Elastic’s customer count or its subscription revenue per customer stalled. Another item we’ll be watching because of Elastic’s geographic mix, with 40% of its revenue outside of the U.S., is the dollar and its corresponding foreign exchange impact.
Target Price: Reiterate $105; Rating: One
Panic Point: $68
RISKS: Enterprise software spending, AI adoption, competitive dynamics, foreign exchange risk.
Lockheed Martin Corp. LMT; $545.35; 290 shares; 3.33%; Sector: Aerospace & Defense
UPDATE: Lockheed Martin (LMT) had a volatile month but as the market sagged late in October LMT shares ended the month lower. The stock hit fresh all-time highs in several days in early October after breaking out from an upward-sloping base. That is the best sort of breakout, in the direction of the trend. We used that move-up to new highs to book nice gains in the stock. The shares continued to be a strong performer but that changed when the company delivered its September-quarter results, which included record backlog and a fresh dividend increase. Some with more aggressive price targets on Wall Street cited overly conservative guidance, but as upper end of the range price targets were trimmed, we saw enough to lift our price target to $650 from $625, rause our rating to a One, and pick up more LMT shares for the portfolio near $578. When we made those moves, we recognized the shares would likely settle out in the following days. As they continued to move lower, becoming oversold this week, we picked up more shares near $548. In that trade, we noted Lockheed stands to benefit in the coming quarters due to rising F-35 production, working off a record backlog, rising international defense spending, and the need to re-arm U.S. defense stockpiles. We are inclined to be patient with Lockheed as ramping production volumes drive operating leverage that falls to the bottom line. When Lockheed reports its December quarter results, it will share an updated multiyear production schedule, which will give us a clear view of what lies ahead. Lockheed’s next quarterly dividend of $3.30 per share will be paid on December 27 to shareholders of record on December 2.
1-Wk. Price Change: -3.0%; Yield: 2.4%
INVESTMENT THESIS: Lockheed Martin is the largest defense contractor globally and has dominated the Western market for high-end fighter aircraft since the F-35 program was awarded in 2001. Lockheed's largest segment is aeronautics, which is dominated by the massive F-35 program. Lockheed's remaining segments are rotary and mission systems, which is mainly the Sikorsky helicopter business; missiles and fire control, which creates missiles and missile defense systems; and space systems, which produces satellites and receives equity income from the United Launch Alliance joint venture. Historically, the stability of defense spending has been a haven during periods of economic uncertainty, and we see that repeating once again even as geopolitical conflicts are likely to lead to incremental demand for Lockheed's products. The company has increased its dividend consistently over the last 19 years and is widely expected to boost it again in the coming days. In October 2022, Lockheed announced its board authorized the purchase of up to an additional $14.0 billion of LMT stock under its share-repurchase program.
Target Price: $650; Rating: One
Panic Point: $515
RISKS: Contracts and budget risk with the U.S. government and the Department of Defense, F-35 program funding and renewal, competition, and subcontractor issues.
Marvell Technology MRVL; $84.77; 2,385 shares; 4.21%; Sector: Technology
UPDATE: Shares of Marvell (MRVL) were an October champ with their double-digit climb lifted by favorable data points and comments on AI demand as well as growing confidence for a rebound in its Enterprise Networking and Carrier Infrastructure businesses. Those comments included blowout September revenue reports from Taiwan Semiconductor (TSM) and Hon Hai, Ericsson (ERIC) confirming our view AI adoption will chew through existing network capacity, as well as more recent ones from Alphabet, IBM, ServiceNow, Microsoft, Digital Realty Trust, and of course on Nvidia (NVDA). The strength in MRVL shares led to another round of prudent portfolio management, which led us to lock in a triple-digit gain. Increasing capital spending on AI and data center from Big Tech companies reinforces our bullish stance on MRVL shares but it was Amazon’s comments about strong demand for its Tranium2 AI chipset that led us to boost our MRVL price target on Friday to $105 from $95. We’ll continue to watch the overall position size of MRVL shares in the overall portfolio. Should they cross the 4.5% level following Taiwan Semi’s (TSM) October revenue report or when Marvell reports its quarterly results, we would be inclined to conduct some prudent portfolio management. Such a move would lock in another slice of highly profitable gains. Even so, we see our MRVL thesis playing out over several quarters, and we are inclined to be long-term holders of the shares, but if they pass $90, we may look to revisit our current One rating.
1-Wk. Price Change: 3.4%; Yield: 0.3%
INVESTMENT THESIS: Marvell is a fabless supplier of high-performance standard and semi-custom infrastructure semiconductor solutions. These solutions power the data economy, enabling the data center, carrier infrastructure, enterprise networking, consumer, and automotive/industrial end markets. With roughly 75%-80% of Marvell's revenue stream tied to digital infrastructure, we see it continuing to benefit from rising content consumption and creation. Pointing to that rising demand that necessitates network densification and the build of digital infrastructure, Ericsson sees global monthly average usage per smartphone reach 46 gigabytes (GB) by the end of 2028 vs. 19 GB in 2023 and 15 GB in 2022.
Target Price: Reiterate $105; Rating: One
Panic Point: $64
RISKS: Technology risk, customer risk, competition risk, reliance on manufacturing partners, and supply chain constraints.
Nvidia Corp. NVDA; $135.40; 1,510 shares; 4.29%; Sector: Technology
UPDATE: Even though Nvidia (NVDA) shares gave back some of their October gains in tandem with the Nasdaq Composite selloff during the last week of the month, they still delivered an impressive 9% increase for the portfolio’s position. Signals for ramping AI adoption to increasing capital spending comments on AI and data centers tell us we are still in the early innings of AI chip demand and that keeps us bullish on NVDA shares. Other data, including data center revenue at Advanced Micro Devices (AMD) and Intel (INTC), reaffirm the share gains being had a Nvidia. Blackwell unit shipments are expected to start this quarter and ramp in the following ones, bringing with it a nice step up in Nvidia’s revenue. As Blackwell production ramps, we should see margins improve as Nvidia moves down the production curve. Ahead of Nvidia’s November 20 earnings date, we’ll be scrutinizing October revenue reports from Taiwan Semi and Hon Hai, revisiting our $175 price target as needed.
1-Wk. Price Change: -4.3%; Yield: 0.0%
INVESTMENT THESIS: Nvidia is well positioned to benefit from ramping AI and data center spending. The company pioneered accelerated computing to help solve the most challenging computational problems. Nvidia is now a full-stack computing infrastructure company with data-center-scale offerings that are reshaping the industry. The company's full stack includes the foundational CUDA programming model that runs on all Nvidia GPUs, as well as hundreds of domain-specific software libraries, software development kits, or SDKs, and Application Programming Interfaces, or APIs. This deep and broad software stack accelerates the performance and eases the deployment of Nvidia accelerated computing for computationally intensive workloads such as artificial intelligence, or AI, model training and inference, data analytics, scientific computing, and 3D graphics, with vertical-specific optimizations to address industries ranging from healthcare and telecom to automotive and manufacturing. Nvidia reports in two business segments: Compute & Networking and Graphics. The Compute & Networking segment (78% of revenue, 85% of operating income) is comprised of Data Center accelerated computing platforms and end-to-end networking platforms, including Quantum for InfiniBand and Spectrum for Ethernet; NVIDIA DRIVE automated-driving platform and automotive development agreements; Jetson robotics and other embedded platforms; Nvidia AI Enterprise and other software; and DGX Cloud software and services. The Graphics segment (22% of revenue, 15% of operating income) includes GeForce GPUs for gaming and PCs, the GeForce NOW game streaming service and related infrastructure; Quadro/NVIDIA RTX GPUs for enterprise workstation graphics; virtual GPU, or vGPU, software for cloud-based visual and virtual computing; automotive platforms for infotainment systems; and Omniverse Enterprise software for building and operating metaverse and 3D internet applications.
Target Price: $175; Rating One
Panic Point: $108
RISKS: Market and interest rate risk, credit risk, country risk, and operational risk, including cybersecurity.
Qualcomm Inc. QCOM; $165.27; 1,034 shares; 3.58%; Sector: Technology
UPDATE: Shares of Qualcomm (QCOM) continued to underperform the market in October amid a confluence of concerns that include market concerns over the iPhone upgrade cycle, reports Apple may look to bring its own chipset to low-tier iPhones, and the pending legal battle with Arm (ARM). We shared our view as to why the market was overreacting to an event that the best case for Apple would start slowly and with lower-end iPhone models in the coming years. We also explained our thinking for how we see a QCOM-ARM resolution playing out, but recognize this overhang could be with us until late this year. Despite those concerns, industry data showed the rebound in the smartphone market continued and also in the PC market, with AI PC adoption rising nicely. That was reaffirmed by the strong smartphone figures found in Taiwan Semi’s September quarter report. Late in October, Qorvo (QRVO) cited weakness in the mid-tier smartphone market in favor of lower-tier models but also shared demand remains strong for flagship and premium models. Samsung (SSNLF) reaffirmed that with its quarterly results and guidance. While Apple shied away from specific iPhone guidance for its December quarter, we see a more pronounced upgrade cycle unfolding in 2025 as more Apple Intelligence features are released. When Qualcomm reports its quarterly results on November 6, those results should start to capture the AI PC opportunity for Qualcomm. While those initial volumes will be modest compared to those for the company’s smartphone business, they carry far more favorable average selling prices. This year less than 10% of all notebook PCs are expected to ship with that connectivity but that is expected to ramp to nearly half of all shipments in the next few years. And, as we’ve discussed, other opportunities in the auto and IoT markets should help reduce Qualcomm’s exposure to the smartphone market. As that mix shift occurs, we could see the market revisit how it values QCOM shares. The next set of catalysts we are watching for besides the company’s earnings reports are the October revenue reports from TSM and Hon Hai.
1-Wk. Price Change: -2.9%; Yield: 2.1%
INVESTMENT THESIS: Qualcomm focuses on foundational technologies for the wireless industry, including 3G (third generation), 4G (fourth generation), and 5G (fifth generation) wireless technologies and processor technologies including high-performance, low-power computing, and on-device artificial intelligence technologies. As a connected processor company, its technology roadmap aims to enable the connected intelligent edge (the next generation of smart devices) across industries and applications beyond handsets, including automotive and the Internet of Things (IoT). Qualcomm has three reportable segments: QCT (Qualcomm CDMA Technologies) semiconductor business, which develops and supplies integrated circuits and system software based on 3G/4G/5G and other technologies for use in mobile devices; automotive systems for connectivity, digital cockpit, and ADAS/AD; and IoT including consumer electronic devices; industrial devices; and edge networking products. QCT accounts for 80%-85% of revenue. QTL (Qualcomm Technology Licensing) licensing business grants licenses or otherwise provides rights to use portions of the company's intellectual property portfolio, which includes certain patent rights essential to and/or useful in the manufacture and sale of certain wireless products. QTL accounts for ~15% of Qualcomm's revenue but contributes a greater portion of the company's operating income.
Target Price: $255; Rating: One
Panic Point: $148
RISKS: Customer risk, technology advancement, competition risk, third-party supplier, and manufacturing partner risk.
Universal Display OLED; $180.25; 990 shares; 3.75%; Sector: Technology
UPDATE: Following their 8.4% gain in September, shares of Universal Display (OLED) spent most of October trading sideways before accelerating higher ahead of the company’s September-quarter earnings report on October 30. While the company trounced consensus EPS for the quarter, revenue of $161.6 million came up short compared to the $165.3 million market forecast. That miss and management re-setting its 2024 revenue expectations to $625 million to $645 million versus its June-quarter forecast of $645 million to $675 million hit OLED shares as it implied an either sequentially flat December quarter or one that could be down low double-digits. In our Alert discussing this, we discussed the possibility the guidance from Universal’s management could be overly conservative given upbeat comments from Samsung (SSNLF) about the prospects for flagship and premium smartphone models in the current and ensuing quarters. Our focus for Universal and its shares remains on the wider adoption of organic light-emitting diode technology in multiple markets (TV, PC monitors, tablets, auto) and further penetration in the smartphone market. This was captured rather clearly during Samsung’s earnings call on Thursday morning with the comment that the penetration rate for organic light-emitting diode displays will continue to rise in the smartphone market as more new smartphone models are released. To that, we can add reports that Apple’s entire smartphone lineup will use this display technology starting this year. That combination gives us little reason to alter our long-term price target of $250 for OLED. With OLED shares exiting November near $180, they have ample upside to that target and that paired with our longer-term focus led us to pick up some additional shares on Friday, November 1. Next catalysts for the shares include quarterly results from Qualcomm and Skyworks as well as Taiwan Semi’s October revenue report.
1-Wk. Price Change: -10.8%; Yield: 0.9%
INVESTMENT THESIS: Universal Display focuses on the development and commercialization of organic light-emitting diode (OLED) technologies and materials for use in display and solid-state lighting applications. OLED displays are capturing a growing share of the display market, especially in the mobile phone, television, monitor, wearable, tablet, notebook, personal computer, augmented reality (AR), virtual reality (VR), and automotive markets. This adoption reflects advantages over competing display technologies concerning power efficiency, contrast ratio, viewing angle, video response time, form factor, and manufacturing cost. Universal's business strategy is to develop new OLED materials and sell existing and new materials to product manufacturers for display applications, such as mobile phones, televisions, monitors, wearables, tablets, portable media devices, notebook computers, personal computers, and automotive applications, and specialty and general lighting products. The company also looks to license its OLED material, device design, and manufacturing technologies to those manufacturers. As such, Universal has a significant portfolio of proprietary OLED technologies and materials with more than 5,500 patents issued and pending worldwide.
Target Price: Reiterate $250; Rating: One
Panic Point: $165
RISKS: Patent and Intellectual property protection; maintaining OLED manufacturing and customer relationships; technology risk; market risk.
Vulcan Materials Company VMC ; $270.39; 613 shares; 3.49%; Sector: Building Materials
UPDATE: For most of October, shares of Vulcan Materials (VMC) were a modest drag on the portfolio as short interest on the shares rose following the September and October hurricanes. Weather can be a headwind for construction activity, and that goes double for the back-to-back Helene and Milton hurricanes. While that combination weighed on Vulcan’s September-quarter revenue, continued underlying pricing strength shielded Vulcan, allowing it to deliver nice adjusted margin expansion despite the hurricane-led volume declines. While the severe weather across June through early October made VMC shares a somewhat volatile holding, the expectation for further price realization in 2025 paired with continued infrastructure and data center construction spending and prospects for improving housing construction keep us long-term bullish on the shares. Based on the stickiness of 2025 pricing and its impact on margins, we will revisit our VMC price target. As the post-earnings pop in VMC shares fades, which is likely as short covering peters out, we suggest members patiently wait on the sidelines until we move past the Fed’s November meeting next week.
1-Wk. Price Change: 5.4%; Yield: 0.7%
INVESTMENT THESIS: Vulcan Materials operates primarily in the U.S. and is the nation's largest supplier of construction aggregates (primarily crushed stone, sand, and gravel), a major producer of asphalt mix and ready-mixed concrete, and a supplier of construction paving services. Its products are the indispensable materials used in building homes, offices, places of worship, schools, hospitals, and factories, as well as vital infrastructure including highways, bridges, roads, ports and harbors, water systems, campuses, dams, airports, and rail networks. Ramping spending associated with the Biden Infrastructure Law should drive demand for Vulcan's products over the coming years. Vulcan has historically complemented its organic growth prospects by acquiring businesses to expand its geographic reach and product scope. Since 2014, the company has acquired more than two dozen companies, including the 2021 acquisition of U.S. Concrete. That combination has allowed the company to deliver steady top and bottom-line growth over the last decade, with only a modest decline when the pandemic hit in 2020.
Target Price: Reiterate $300; Rating: One
Panic Point: $225
RISKS: General economic and business conditions; dependence on the construction industry; timing of federal, state, and local funding for infrastructure; changes in the level of spending for private residential and private nonresidential construction.
TWOS
Apple AAPL ; $222.91; 790 shares; 3.70%; Sector: Technology
UPDATE: Apple shares were volatile during October due to mixed reports and speculation about the latest upgrade cycle for new iPhone models. Our position was and remains that attractive trade-in values are helping foster some upgrade activity, but the real push isn’t likely to come until Apple releases more robust Apple Intelligence features. That thinking was echoed by AT&T (T) and Verizon (VZ) on their September-quarter earnings calls. In our view, a more pronounced upgrade cycle is likely to begin when Apple ships iOS 18.2, which will include ChatGPT integration, and is expected to debut in late November-early December. That timing led Apple to issue what we called cautious guidance for the current quarter but it also makes the highly anticipated upgrade cycle touted by many on Wall Street more of a 2025 story than one for this year. With more Apple Intelligence features targeted for not only iPhone but also Apple’s other product categories including Mac, iPad, and Wearables, we see a similar cadence unfolding for them as well as other software updates are released. As that happens, we should see further lift in the Services business, driving overall profits and EPS higher. For now, we will stick with our $250 price target but will revisit it as warranted following the release of iOS 18.2 as well as insights in quarterly results and guidance from Qualcomm and Skyworks (SWKS). In keeping with our Two rating, should we see Apple shares pull back closer to $200, all things being equal, that would be an area of interest for us to contemplate adding more shares.
1-Wk. Price Change: -3.7%; Yield: 0.4%
INVESTMENT THESIS: While we acknowledge that near-to-midterm performance remains heavily influenced by iPhone sales, the dynamic is shifting as investors finally place greater emphasis on Services growth. We are bullish on the 5G upgrade cycle and believe longer-term upside will continue to come as Services revenue grows its share of overall sales. Services provide for a recurring revenue stream at higher margins, a factor that serves to reduce earnings volatility while allowing for a higher percentage of sales to fall to the bottom line; as a result, we believe that Services growth and the installed base, are much more important than how many devices the company can sell in each 90-day period. In addition to improved profitability, we also believe the transparent nature of this revenue stream will demand an expanded price-to-earnings multiple as segment sales grow. Furthermore, we believe that Apple's desire to push deeper into the healthcare arena will help make its devices invaluable as more life-changing features are added and the company works to democratize health records. Lastly, also see upside resulting from increased adoption of wearables (think the Apple Watch) and potential new product announcements such as an AR/VR headset or an update on Project Titan, the company's secretive autonomous driving program.
Target Price: Reiterate $250; Rating: Two
Panic Point: Reiterate $185
RISKS: Slowdown in consumer spending, competition, lack of new product innovation, elongated replacement cycles, failure to execute on Services growth initiative.
Applied Materials Inc. AMAT; $183.38; 790 shares; 3.04%; Sector: Semiconductor Manufacturing
UPDATE: Applied had a rough month of October, falling about 10% on very heavy turnover with ample share pressure resulting from competitor ASML (ASML), which delivered a massive miss and earnings warning mid-month. As we suspected that was primarily due to issues at Intel (INTC), a large customer for ASML but a modest one for Applied. That along with Taiwan Semi (TSM) sharing that it would up its capital spending led us to pick up more AMAT shares on October 17 near $190. Since then, Big Tech companies have shared plans for higher capital spending in the coming quarters to address near-term capacity issues. We see that and the continued rebound in other key chip markets tightening industry capacity in the coming quarters, which along with CHIPs Act dollars flowing point to a better 2025 for Applied. AMAT will next report its earnings on November 14.
1-Wk. Price Change: -1.7%; Yield: 0.9%
INVESTMENT THESIS: Applied provides manufacturing equipment, services, and software to the semiconductor, display, and related industries. With its diverse technology capabilities, Applied delivers products and services that improve device performance, power, yield, and cost. Applied's customers include manufacturers of semiconductor chips, liquid crystal, and organic light-emitting diode displays, and other electronic devices. Applied operates in three reportable segments: Semiconductor Systems (73% of 2022 revenue, 78% of 2022 operating income), Applied Global Services (22%, 19%), and Display and Adjacent Markets (5%, 2%). Key customers include Samsung (12% of 2022 sales), Taiwan Semiconductor (20%), and Intel (10%).
Target Price: Reiterate $220; Rating: Two
Panic Point: $165
RISKS: Manufacturing and Supply Chain, Competitive Factors, Government Regulation, Technology Change.
Costco Wholesale COST; $877.31; 210 shares; 3.87%; Sector: Consumer Staples
UPDATE: Following a nice 4.3% gain in Q3 2024, shares of Costco (COST) shed just over 1% in October. The September Retail Sales report confirmed Costco continues to take consumer wallet share, and we see it being a prime beneficiary as consumers look to stretch their spending dollars during the holiday shopping season. We also see further gains for the all-important membership fee revenue stream. Costco aims to add another 26 net new locations in the coming year after opening 30 over the last 12 months, 14 of which opened in the August quarter. These recent and projected openings should help drive further gains in the company’s membership, which stood at 76.2 million paid households and 136.8 million cardholders exiting August. To that, we can add the 35.4 million paid executive memberships, up 9.6% versus last year. In thinking about those figures, let’s remember the membership price increase went into effect on September 1, so it makes sense that as newer memberships anniversary, Costco will see more benefits from that price increase. If we were to see COST shares successfully test the 100-day moving near $874 it could be an opportunity for members who are underweight COST shares to pick some up. Our next known catalyst for COST shares will be the company’s October revenue report on November 6. Soon after Costco will pay its next quarterly dividend of $1.16 per share on November 15 to shareholders of record on November 1.
1-Wk. Price Change: -1.6%; Yield: 0.5%
INVESTMENT THESIS: We like Costco's long-term prospects, driven by a club-based operating model that focuses on volumes, not margins, and therefore offers its customers a value proposition of everyday low prices. The strength of this model has created an incredibly loyal customer base with low churn and continued share gains in both bricks-and-mortar and e-commerce. This is a global concept, evidenced by the strength of sales both in the U.S. and abroad, which includes an emerging China opportunity. We see the company's membership model as a key differentiator vs. other retailers and its plans to open additional warehouse locations in the coming quarters should drive retail volumes and the higher-margin membership fee income as well. We also appreciate management's approach to capital returns and their willingness to return cash when it is in excess on the balance sheet.
Target Price: Reiterate $950. Rating: Two
Panic Point: $750
RISKS: Inability to pass through higher costs, fuel prices, weaker consumer, and membership churn.
Eaton Corp. ETN; $335.00; 360 shares; 2.53%; Sector: Industrials
UPDATE: Eaton (ETN) shares made a round-trip during October, rising to touch $350 mid-month only to fall back to their September starting point near $331. Most of the drop in ETN came this week in what we would call an over-exaggerated move following the company’s September-quarter results and guidance that included a modest impact from recent hurricanes. We used that pullback in the shares to build up the portfolio’s exposure given the company’s record backlog levels that support strong performance ahead as multiple factors, including data center construction, exacerbate the power pain point. Based on that backlog and the expected ramp in mega construction projects in 2025, we boosted our ETN price target to $380 from $350. Even after that addition, the portfolio’s overall ETN position remains on the smaller side. Should we see the shares pull back further following the Fed’s November policy meeting and bring them near their 100-day moving average of $314, it would give us a reason to pick up more shares and potentially revisit our Two rating. We continue to see Eaton’s business benefiting from the Fed’s eventual efforts to bring monetary policy back to a more neutral footing, which should stimulate overall construction demand in the coming quarters.
1-Wk. Price Change: -2.8%; Yield: 1.1%
INVESTMENT THESIS: Eaton is an intelligent power management company that makes products for data center, utility, industrial, commercial, machine building, residential, aerospace, and mobility markets. That business is positioned to capitalize on the megatrends of electrification, energy transition, and digitalization. We see Eaton helping address the power pain point created by data center, EV charging infrastructure, and other drivers of electricity demand. Research estimates that data center power demand will grow 160% by 2030, accounting for 3%-4% of global power up from 1%-2% today. Data centers will use 8% of U.S. power by 2030, compared with 3% in 2022.
Target Price: Reiterate $380; Rating: Two
Panic Point: $275
RISKS: Raw material costs, labor costs, end market volatility, government legislation.
First Trust Nasdaq Cybersecurity ETF CIBR; $60.25; 2,530 shares; 3.20%; Sector: Cybersecurity
UPDATE: Each time we share ripped-from-the-headlines confirmation points for the portfolio and its underlying strategy, one constant is the signals for cybersecurity demand. That consistent support tied with research firm Gartner’s information security forecast that calls for cybersecurity spending to accelerate in 2025 led us to increase our First Trust Nasdaq Cybersecurity ETF CIBR price target to $68 from $62 in early October. That same consistent flow of cyberattack headlines made CIBR shares a nice contributor to the portfolio’s overall performance in October. We still believe heavy spending in this space is necessary for businesses to protect their crown jewels. Bad actor usage of AI in their attacks means we are not likely to see any slowdown in cybersecurity spending on the horizon. Navigating the upcoming earning season, we’ll be listening for management comments about cybersecurity spending, and revisiting our CIBR price target as needed. When cybersecurity companies report their earnings, we’ll be looking for rising deferred revenue metrics in their financials, a harbinger of higher revenue ahead. For newer members who have missed out on CIBR shares, we see strong support between $57-$59.
1-Wk. Price Change: -1.4%; Yield: 0.0%
INVESTMENT THESIS: The First Trust Nasdaq Cybersecurity ETF seeks investment results that correspond generally to the price and yield (before the fund's fees and expenses) of an equity index called the Nasdaq CTA Cybersecurity Index. The Nasdaq CTA Cybersecurity Index is designed to track the performance of companies engaged in the cybersecurity segment of the technology and industrial sectors. It includes companies primarily involved in the building, implementation, and management of security protocols applied to private and public networks, computers, and mobile devices to protect the integrity of data and network operations. To be included in the index, a security must be listed on an index-eligible global stock exchange and classified as a cybersecurity company as determined by the Consumer Technology Association. Each security must have a worldwide market capitalization of $250 million, have a minimum three-month average daily dollar trading volume of $1 million, and have a minimum free float of 20%.
Target Price: Reiterate $68; Rating: Two
Panic Point: Reiterate $50
RISKS: Cybersecurity spending, technology, and product development, the timing of product sales cycle, new products, and services in response to rapid technological changes and market developments as well as evolving security threats.
Labcorp Holdings Inc. LH; $227.10; 610 shares; 2.92%; Sector: Healthcare
UPDATE: Shares of Labcorp (LH) resumed their upward climb in October, building on their 10% gain during Q3 2024. Following the company’s quarterly results, we lifted our price target to $260 from $235, while Barclays lifted its to $249 from $234 and Piper Sandier reset its target at $240 from $235. Our price target adjustment reflected continued momentum in the company’s business and prospects for incremental margin improvement in 2025 at the larger Diagnostics segment that drives 75% of the company’s revenue and operating profits. We continue to favor LH shares as the company continues to benefit from the growing number of hospital and regional lab deals it is inking and digests its acquisition of Invitae. While Invitae was a drag on diagnostic margins in the quarter, Labcorp continues to see it being accretive next year, which bodes well for incremental profit dollars falling to the bottom line. Management has the capacity, and the company has the balance sheet for other nip-and-tuck acquisitions in this still-fragmented medical testing and diagnostics business. Should we see LH drift back to the $215-$220 level as the wave of short-covering subsides, that would be an area at which we would consider adding additional shares.
1-Wk. Price Change: -0.7%; Yield: 1.3%
INVESTMENT THESIS: Labcorp is a global leader in innovative and comprehensive laboratory services that provides vital information to help doctors, hospitals, pharmaceutical companies, researchers, and patients make clear and confident decisions. By leveraging its diagnostics and drug development capabilities, the company provides insights and accelerates innovations to improve health and improve lives. The company is organized under two segments, consisting of Diagnostics Laboratories (Dx), which includes routine testing and specialty/esoteric testing, and Biopharma Laboratory Services (BLS), consisting of Early Development Research Laboratories and Central Laboratory Services. Our attraction to LH shares stems from the combination of the aging population driving diagnostic testing growth and the increasing array of diagnostic testing as well. That combination is expected to drive the healthcare testing services market to $12.6 billion by 2029, from $7.4 billion in 2024, according to Markets and Markets. To augment its position in oncology, women's health, autoimmune diseases, and neurology, the company has been expanding through acquisitions and partnerships with health systems and regional local labs.
Target Price: Reiterate $260; Rating: Two
Panic Point: Reiterate $190
RISKS: Macroeconomic factors, changes in healthcare reimbursement models and products, government regulations, product discontinuations or recalls.
Mastercard MA; $508.08; 275 shares; 2.94%; Sector: Info. Tech
UPDATE: Mastercard (MA) was a steady performer for the portfolio in Q3 2024 and that continued in October, with the shares adding further gains. Favorable September jobs data and a more robust September Retail Sales report showed consumers continued to open their wallets during helped lift MA shares as did the strong showing of Amazon’s Prime Big Deal Days event. Favorable real wage gains found in October jobs data supports continued consumer spending as we head into the holiday shopping season. So do falling gas prices, further progress on inflation, and lower interest rates. Expectations for the 2024 holiday shopping season are favorable and based on comments from United Airlines (UAL) and American Express (AXP) so is December quarter travel. When Mastercard reported its September-quarter results, we maintained our $535 target for the shares given what see as reasonable guidance for the current quarter. As we move through November and early December, signs of more favorable holiday spending could lead us to revisit that target. At the same time, if market forces pull MA near key support levels, we’ll consider adding additional shares. While the 50-day moving average sits near $494, we see far more support between the 100-day and 200-day averages at $471 and $465, respectively.
1-Wk. Price Change: 0.1%; Yield: 0.5%
INVESTMENT THESIS: Mastercard is a card network company that benefits from the secular shift away from cash transactions and toward card-based and electronic payments. On Covid-19 dynamics, we view MA as a "reopening" play and an economic recovery play within technology because its cross-border volumes fell sharply during the pandemic but will rebound as mobility increases and travel restrictions ease. Mastercard has more international exposure relative to Visa (V), making its growth outlook more susceptible to new travel restrictions. However, we view MA as the better long-term play as we are betting on that inevitable recovery.
Target Price: $535; Rating: Two
Panic Point: $400
RISKS: The recovery in cross-border transactions, regulation in the payments market, competition from other fintechs, and pricing pressures.
Meta Platforms META; $567.16; 145 shares; 1.73%; Sector: Communication Services
UPDATE: Following strong gains in August and September, Meta (META) shares trucked higher in October but ultimately closed the month lower following the company’s earnings report on October 30. As we suspected could happen, the market selloff reflected the market’s reaction to management’s comment that it continues to expect significant capex growth next year. However, what we saw in the quarter’s results showed Meta continues to deliver meaningful margin expansion despite ramping capex levels. Meta’s operating margin in Q3 2024 rose to 42.75%, the highest level in multiple quarters and the company’s guidance suggests a modest decline in the current quarter to around 42% or so based on its $45 billion to $48 billion December revenue forecast. Looking at these figures that point to greater profitability this year compared to 2023 means the market should eventually deduce that Meta is not struggling to invest for the future at the expense of near-term profitability. Even if its H2 2024 operating margin of 42.4% is the run rate for 2025, it’s still a nice step higher, which means Meta can continue to invest while delivering favorable bottom-line growth even as it faces more difficult year-over-year revenue comparisons in H2 2025. Those observations led us to boost our META price target to $675 from $630 and pick up additional shares for the portfolio. Should we see META move lower toward the 50-day moving average near $555, all things being equal, we would be inclined to pick up more shares, and potentially revisit our Two rating. For now, we’ll leave our META panic point at $475 but as the stock moves higher, we expect it will be lifted higher. We were not alone in boosting our price target as Susquehanna, Evercore ISI, and Mizuho all joined us at $675 while UBS pushed its target to $719.
1-Wk. Price Change: -1.1%; Yield: 0.4%
INVESTMENT THESIS: Meta segments its business between Family of App Products, which includes Facebook, Instagram, Messenger, Threads, and WhatsApp, and Reality Labs Products, which includes its metaverse and investments and future product R&D. Family of Apps accounts for ~99% of company revenue and 100% of company operating profit. Substantially all of Meta’s revenue is currently generated from advertising on Facebook and Instagram. Family daily active people (DAP) was 3.27 billion on average for June 2024, an increase of 7% year-over-year. Meta forecasts capital expenditures of approximately $37 billion to $40 billion in 2024 and expects its capital expenditures to grow significantly in 2025 to support our AI research and product development efforts. Meta is positioned to benefit from the ongoing shift toward digital advertising and the adoption of AI across its product offerings. We recognize Meta is ramping up capital spending as part of the current AI arms race, but we see that as an investment that should drive productivity in its core advertising business. As the company harvests that investment, we could see a step up in margins much like we saw in 2023.
Target Price: Reiterate $675; Rating: Two
Panic Point: $475
RISKS: Ability to add and retain users and user engagement; marketing spend; new products or changes to existing ones; competitive risk, geopolitical risk.
Microsoft Corp. MSFT; $410.37; 425 shares; 3.67%; Sector: Technology
UPDATE: Like several other tech holdings in the portfolio, while Microsoft shares moved higher for most of October, those gains were erased with the company’s September-quarter earnings report on October 30. We’re not referring to the quarterly results that cleared consensus expectations with EPS of $3.30 per share on revenue that climbed 16% year over year to $65.58 billion, but rather management’s guidance that called for slightly slower revenue growth this quarter and next at Azure. To be clear, “slightly slower” means around 31%-32% instead of the 34% growth posted by Azure in the September quarter. Viewed against that and the prospects for Azure’s revenue to re-accelerate as incremental cloud capacity comes on stream over the coming quarters, we see the post-earnings drop in MSFT shares as a big overreaction. While we maintained our $480 price target, several other price targets, including those from JPMorgan, TD Cowen, BMO Capital, and others moved lower to $465-$495 from $470-$500. As the market digests the October Employment Report and the Fed’s policy comments next week, should we see the shares move closer to the $400 level or lower, we would be interested in scooping up more MSFT shares, and possibly revisiting our current Two rating.
1-Wk. Price Change: -4.2%; Yield: 0.8%
INVESTMENT THESIS: We believe the cloud to be a secular growth trend and that upside to the shares will result from Microsoft's hybrid cloud leadership as the company grabs market share in this expanding industry. While companies may look to build out multi-cloud environments, Microsoft's Azure offering will be a prime choice thanks to its decision to provide the same "stack" used in the public cloud, to companies for their on-premises data centers. Additionally, we would note that hybrid environments are currently the preference for most companies because they allow them to maintain critical data in-house while taking advantage of the agility and scalability provided by public clouds. Outside of the cloud opportunity, we maintain a positive view on the company's growing gaming business, which we believe is becoming an increasingly prominent factor in the Microsoft growth story as gaming becomes more mainstream, management works to convert its gaming revenue from one-time license purchase to a recurring subscription model and as technologies like augmented/virtual reality evolve. Finally, as it relates to LinkedIn and other subscription-based services such as O365 and various Dynamics products, we continue to value them highly for their recurring revenue streams, which, we remind members, provide for greater transparency of future earnings.
Target Price: $480; Rating: Two
Panic Point: Reiterate $350
RISKS: Slowdown in IT spending, competition, cannibalization of on-premises business by the cloud.
Morgan Stanley MS; $116.85; 1,615 shares; 3.97%; Sector: Financial Services
UPDATE: Similar to BAC, Morgan Stanley (MS) shares were a strong mover and shaker in the portfolio during October, rising double digits compared to the 1% drop in the S&P 500. The catalyst for that outperformance was Morgan’s September-quarter results as well as its guidance for the current quarter, both of which supported our bullish stance on the company’s investment banking and asset/wealth management businesses. While the post-earnings pop led us to do some prudent portfolio management on MS shares, locking in a very respectable 18% gain, we lifted our price target to $130 from $120 and downgraded the shares to a Two rating. We continue to see Morgan Stanley’s business and the shares well positioned as the Fed delivers incremental interest rate cuts over the ensuing months. If we saw market forces pull MS shares back near the $105 level, the potential risk-to-reward trade-off could prompt a re-think of our current Two rating. Signs that improving sentiment for IPO activity is translating into a quicker rebound for that market would be another factor that could spur a re-think to our Two rating.
1-Wk. Price Change: 0.0%; Yield: 3.2%
INVESTMENT THESIS: Morgan Stanley reports in three business segments: Institutional Securities (42% of trailing 12-month revenue, 38% of trailing 12-month Income Before Tax), Wealth Management (48%, 55%) and Investment Management (10%, 6%). While the IPO window has yet to reopen, the potential IPO class for 2024 continues to build with recent additions including Panera Bread, Reddit, Fanatics, and Skims, which is backed by Kim Kardashian. This along with the Fed increasingly likely to start cutting rates in H2 2024, suggests we are far closer to the IPO window opening on a sustained basis than we have been in some time. That would be a boon to private equity firms and others that have been nursing IPO candidates during the dark period and a positive for Morgan's investment banking business. Marginally lower rates could also generate a pick-up in M&A activity as the cost of capital with rates improving. As the Fed continues its cutting cycle to get rates back to normalized levels, that effort would also reduce rates for stock market alternatives, ones that quashed the "there is no alternative" trade earlier this year. That along with folks continuing to be behind in retirement savings bodes well for Morgan's wealth management business in the coming quarters.
Target Price: $130; Rating Two
Panic Point: $95
RISKS: Market and interest rate risk, credit risk, country risk, and operational risk, including cybersecurity.
PepsiCo Inc. PEP; $165.59; 800 shares; 2.79%; Sector: Consumer Defensive
UPDATE: Pepsi (PEP) shares finished October down 2.3% but continued to trade within a wide range of $158-$180, and currently reside in the lower part of that spread. Following the company’s September-quarter results that brought a modest reduction for Pepsi’s 2024 organic sales volume but also showed nice margin improvement. While better compared to the last two quarters, operating profits at Quaker are still recovering from product-related issues late in 2023. Further improvement is expected in the current quarter with that business being less of a drag on profit generation and the company’s bottom line. It’s also not lost on us that business will have very easy comparisons in H1 2025, helping drive what should be favorable year-over-year EPS comparisons. That improvement should allow management to “invest responsibly to stimulate growth” at Frito-Lay North America. In our earnings write up we mentioned we would consider adding more PEP shares if they held support near $169, but late this week they passed through that level into oversold territory. That may lead us to do some small buying and even reconsider our Two rating, but we are nearing the seasonally slowest part of the year for PepsiCo’s businesses.
1-Wk. Price Change: -3.6%; Yield: 3.3%
INVESTMENT THESIS: PepsiCo is one of the largest food-and-beverage companies globally. It makes, markets, and sells a slew of brands across the beverage and snack categories, including Pepsi, Mountain Dew, Gatorade, Doritos, Lays, and Ruffles. The firm uses a largely integrated go-to-market model, though it does leverage third-party bottlers, contract manufacturers, and distributors in certain markets. In addition to company-owned trademarks, Pepsi manufactures and distributes other brands through partnerships and joint ventures with companies such as Starbucks. The combination of the consumable nature of those products along with PepsiCo's ability to realize price increases has led to consistent revenue, EPS, and dividend growth during both the Great Recession and the Covid pandemic.
Target Price: Reiterate $185; Rating: Two
Panic Point: $148
RISKS: Economic conditions, supply chain constraints, raw material costs.
ServiceNow NOW; $943.41; 66 shares; 1.31%; Sector: Technology
UPDATE: Shares of ServiceNow (NOW) continued to be a strong performer for the portfolio with their October ascent adding to impressive double-digit gains booked in Q3 2024. Ahead of ServiceNow’s September-quarter earnings report, we boosted our price target to $1,000 from $900 following bullish findings for AI adoption from Capgemini. The company’s beat and raise September quarter was accompanied by partner announcements with Snowflake (SNOW), Nvidia (NVDA), and Pearson (PSO). Tucked inside those quarterly results, the company’s current Remaining Performance Obligation, better known as current backlog, grew 26% year over year to $9.36 billion, nicely ahead of Wall Street expectations and offering several quarters of visibility. After ServiceNow’s earnings report, price targets from JPMorgan, Barclays, Piper Sandler, and Canaccord moved to $950-$1,000 from $820-$850. We continue to see ServiceNow well positioned for continued AI adoption as it focuses on removing friction from enterprise workflow and we like the recurring revenue nature of its predominantly subscription revenue business model (97% of total revenue). ServiceNow continues to target capturing 36% of the $3 trillion expected to be spent on AI by enterprises through 2027 that it addresses. We’ve commented before that if we could go back in time and load up even more on NOW shares than we did in June we would have. While we can’t go back in time, we will keep our eyes open for opportunities to add to the position.
1-Wk. Price Change: -0.8%; Yield: 0.0%
INVESTMENT THESIS: The addition of ServiceNow adds exposure to the enterprise as it deploys AI-enabled solutions across its enterprise workflow platform. The company’s “Now Platform” is a cloud-based solution with embedded AI and machine learning (ML) capabilities that help unify and digitize workflows, driving productivity. At the heart of it, the company’s platform automates workflows across an entire enterprise by connecting disparate departments, systems, and silos in a seamless way to unlock productivity. ServiceNow counts more than 8,100 global customers, including 85% of the Fortune 500, with 97% of its revenue from subscriptions that have notched a 98% renewal rate.
Target Price: Reiterate $1,000; Rating: Two
Panic Point: $750
The Trade Desk TTD; $119.19; 1,485 shares; 3.73%; Sector: Technology
UPDATE: The gains we saw in Trade Desk (TTD) shares during August and September continued into October. Catalysts that spurred them higher over the last few weeks included bullish advertising revenue model comments from Netflix (NFLX) followed by several price targets increases across Wall Street. Those lifted price targets include both Macquarie and KeyBanc lifting their targets to $130 while Wells Fargo shared a new $150 target this week. Trade Desk continues to benefit from the overall mix shift toward digital advertising as advertisers look to reach consumer eyeballs. It is also benefiting from the growing use of advertising business models across streaming video platforms and digital audio like those found at Netflix, Disney (DIS), Warner Bros. Discovery (WBD), Amazon, Spotify (SPOT), and others. Those efforts along with the continued adoption of mobile advertising as well as that for digital audio, including podcasts, have Trade Desk thinking its addressable global digital advertising market has the potential to reach $1 trillion. When Trade Desk reports next week on November 7, we’ll be assessing the upside to our $135 target.
1-Wk. Price Change: -0.2%; Yield: 0.0%
INVESTMENT THESIS: The Trade Desk offers a cloud-based ad-buying platform that empowers its clients to plan and manage data-driven digital advertising campaigns across ad formats and channels, including video, display, audio, digital-out-of-home, and social. Modalities for those campaigns span a multitude of devices, such as computers, mobile devices, televisions, and streaming devices. This positions the Trade Desk to benefit from an accelerating shift toward digital advertising. That shift is expected to see digital advertising account for more than 70% of total ad spending in 2025 rising to ~74% by 2027. We also see the company benefiting from the use of digital advertising in the 2024 presidential campaign, which is expected to grow more than 150% compared to 2024, putting it around $3.5 billion.
Target Price: Reiterate $135; Rating: Two
Panic Point: $94
RISKS: Advertising spending; customer risk and loss; evolving market dynamics and competitive landscape; platform disruptions and outages.
United Rentals URI; $793.47; 148 shares; 2.47%; Sector: Industrials
UPDATE: While shares of United Rentals (URI) followed their more than 25% gain in Q3 2025 by giving back some of those gains in early October, they quickly rebounded and climbed above their September high. However, in recent days as the market has started to question the number of rate cuts the Fed could deliver over the next several months, URI moved back toward its September close. Following United’s September-quarter results on October 24 which offered a favorable view of 2025, we reiterated our $875 target. BofA boosted its target to $910 from $800 while Citi upped its to $955 from $930. Demand for the company’s rental equipment continues to benefit from non-residential construction and multiple new projects across data centers, airports, healthcare, and battery manufacturing. Our take is we’re a few years into multi-year infrastructure stimulus but when we factor in the looming rebound in the housing market, we’re probably about a third of the way through. We continue to think 2026 is a potential peak year for construction activity. If URI shares pulled back to successfully test support at between $776-$777, that would be a nice risk-to-reward trade-off to pick up some additional URI. The next layer of support clocks in near $727, but with the Fed still expected to dial back monetary policy over the coming quarters, we question whether URI could find their way to that price level.
1-Wk. Price Change: -2.3%; Yield: 0.8%
INVESTMENT THESIS: United Rentals, the largest equipment rental company in the world, operates throughout the United States and Canada, and has a limited presence in Europe, Australia, and New Zealand. It serves industrial and other non-construction; commercial (or private non-residential) construction; and residential construction. Industrial and other non-construction rentals represented approximately 50% of rental revenue, primarily reflecting rentals to manufacturers, energy companies, chemical companies, paper mills, railroads, shipbuilders, utilities, retailers, and infrastructure entities; commercial construction rentals represented approximately 46% of rental revenue, primarily reflecting rentals related to the construction and remodeling of facilities for office space, lodging, healthcare, entertainment, and other commercial purposes; and residential rentals around 4% of revenue. We see the company benefiting on three fronts — the seasonal uptick in construction spending; the release of funds and projects associated with the five-year Biden Infrastructure bill; and the company's nip-and-tuck acquisition strategy that should further enhance its geographic footprint.
Target Price: Reiterate $875; Rating: Two
Panic Point: $650
RISKS: Industry and economic risk, competition and competitive pressures, and acquisition risk.
Waste Management WM; $213.99; 530 shares; 2.39%; Sector: Industrials
UPDATE: After trending lower in Q3 2024, Waste Management outperformed in October, rising 4% compared to the S&P 500’ s 1% drop. The bulk of the month’s gain came after its September-quarter earnings report on October 29, which led us to boost our WM price target to $235 from $220 given further margin improvement prospects in the coming quarters at the core Collection and Disposal business. As we explained in that Alert, what our new price target does not include is the pending acquisition of Stericycle (SRCL), which should close later this quarter and expand Waste’s reach into the medical waste market. We see that as a nice complement to our position in Labcorp (LH), and one that should grow nicely alongside the medical test market. We also suspect it will follow the same path as Waste’s solid waste business, meaning nip-and-tuck acquisition opportunities. Once that acquisition is closed and the Waste management team has noted the revenue benefits and near and longer-term cost savings opportunities, we’ll factor that into our price target. Comments made during Eaton’s earnings call about the ramp in construction mega projects points in the coming quarters point to improving demand from Waste’s non-residential business. Late this week, Truist raised its WM target to $250 from $235, while Oppenheimer lifted its to $230 from $224 and Argus reset its target at $240 from $230.
1-Wk. Price Change: 3.5%; Yield: 1.4%
INVESTMENT THESIS: 2024 will see more nonresidential construction activity because of the Biden Infrastructure Law, but now we can finally factor in activity for the CHIPs Act, which saw its first award this week. Other potential drivers include spending associated with the Inflation Reduction Act, including the much-awaited start of building out a nationwide network of EV charging stations. Recently President Biden announced an $8.2 billion passenger rail project, which will likely take several quarters to come onstream, leading us to think it's more of a 2025 catalyst. Alongside that bright outlook for WM's commercial business, automation efforts and pricing power in its sticky residential business should drive margins and EPS generation higher in the coming quarters.
Target Price: $235; Rating: Two
Panic Point: $185
RISKS: Industry and economic risk, competition and competitive pressures, and acquisition risk.
THREES
Axon Enterprise AXON; $425.84; 280 shares; 2.51%; Sector: Aerospace & Defense
UPDATE: Axon has been on quite a roll over the last few months, hitting all-time highs in September and seeing further gains in October. That is just lights out, and we took advantage of the big move up by selling some of our holdings on multiple occasions. On October 7 we sold some shares at around the $420 level, and a week later locked in more gains at $439. Much of the rise could be explained by the very high short interest. Since we entered the stock our average cost basis is less than half the current share price, just a phenomenal selection for our members. In the back half of the month, AXON traded off and closed October near $438, up 6% for the month despite the recent weakness. Until recently the shares had been very overbought, which was part of the rationale for locking in some of those big gains earlier in the month. The MACD indicator has just rolled over and the relative strength index has also turned lower. This suggests a pullback might be in order, but we will have our eye on the company’s earnings report on November 7. In addition to the usual metrics, we’ll be focused on the mix shift toward the company’s cloud business and the impact on margins in the quarter as well as the upcoming ones. What we learn may lead us to re-visit our current $415 price target and it could also lead the consensus price target of $410 to move higher as well. As we revisit our price target we will look to see if we need to do the same with our Three rating.
1-Wk. Price Change: -4.2%; Yield: 0.0%
INVESTMENT THESIS: Axon Enterprise develops, manufactures, and sells conducted energy devices and cloud-based digital evidence management software designed for use by law enforcement, corrections, military forces, private security personnel, and private individuals for personal defense. The company operates in two segments: Taser and Software & Sensors. Taser develops and sells CEDs used for protecting users and virtual reality training. Software & Sensors manufactures fully integrated hardware and cloud-based software solutions such as body cameras, automated license plate reading, and digital evidence management systems. Axon delivers its products worldwide and gets most of its revenue from the United States. President Biden's fiscal year 2023 budget requests a fully paid-for new investment of approximately $35 billion to support law enforcement and crime prevention — in addition to the president's $2 billion discretionary request for these same programs. According to Mordor Intelligence, the wearable, and body-worn cameras market on its own was valued at $1.62 billion in 2020 and is expected to reach $424.63 billion by 2026.
Target Price: Reiterate $415; Rating: Two
Panic Point: $325
RISKS: Manufacturing and supply chain, competitive factors, government regulation, technology change.
