Chart of the Day: Amazon Is Going to Move After Earnings, But Which Way Is It Leaning?
The company's earnings Thursday night will be key for Amazon's future direction.
You've reached your free article limit
You've read 0 of 1 free Pro articles.
The chart of Amazon AMZN shows a pretty tight base being built. That can work positively for the stock if a breakout is imminent.
For most of this month (October) we saw Amazon just straddling the price range of $180-193. A nice, tight base tells us the stock has good support levels in place if/when a pullback occurs.
The indicators are relatively bullish, with strength in the stochastics (momentum) and the parabolic SAR (stop and reverse), which tells us the change in the trajectory of price before it actually occurs.
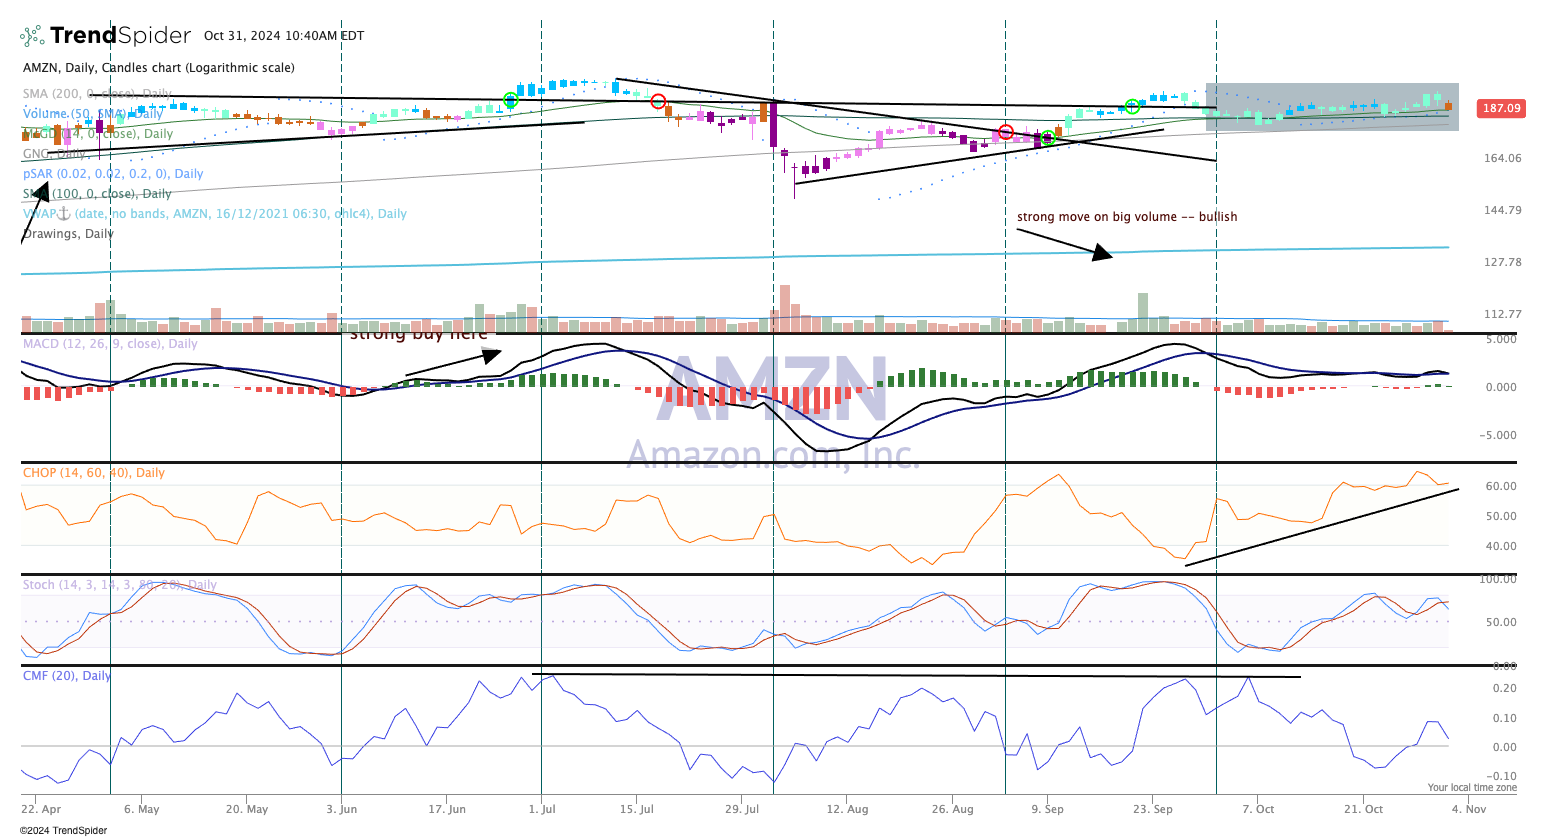
The one fly in the ointment would be the GoNoGo indicator, which just turned amber color, or neutral. This may signal a shift in the direction or simply point out the base needs a longer bit of time to extend.
The chop index (pane 3) is high and declaring no trend in place, but when it comes down that will change.
Certainly, the company's earnings Thursday night will be key for Amazon's future direction.
We rate Amazon a One in TheStreet Pro Portfolio.
At the time of publication, TheStreet pro Portfolio was long AMZN.
