Charting the S&P 500: Weekly Candle Has Bearish Implications
Bullish trend is in place but a brief pullback might scare some out of their positions.
You've reached your free article limit
You've read 0 of 1 free Pro articles.
A six-week run for the bulls since late March has been completed. What is significant about that? Well, in my technical work we often see trends last for about six bars and then begin to stall or reverse. This is not a guarantee to happen, but the timing does make some sense.
The recent move higher in the S&P 500 has lasted this long but so has the Nasdaq move. Again, there is no hard-and-fast rule that says this uptrend should end but certainly the odds are against continuation.
We are in a seasonally bearish period for stocks, interest rates are rising, earnings for the most part are in a “sleepy” phase that won’t likely be a catalyst for the markets to rise further. In addition, we have seen oil rising back up, while the Iran War is not considered over and some lingering worry exists. Volatility has been rising, too.
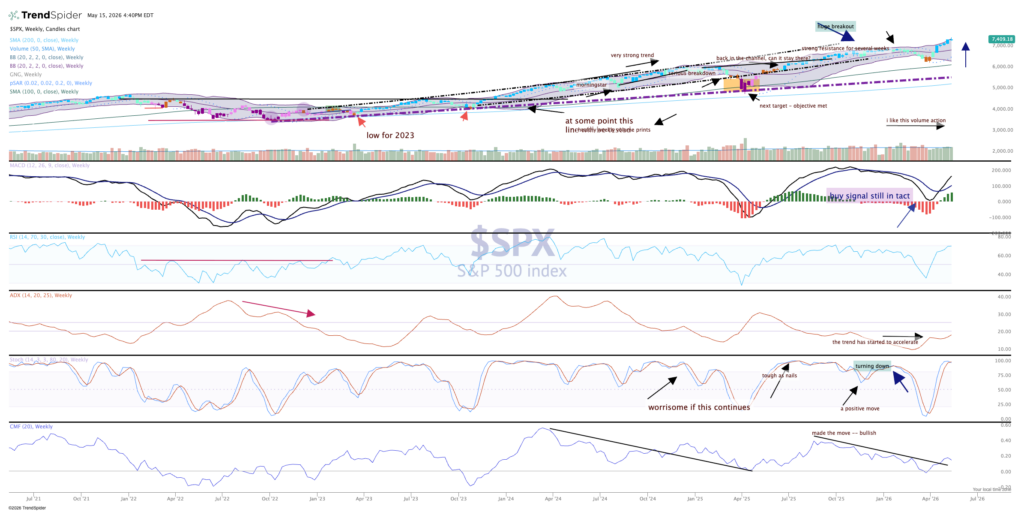
The indicators, however, remain supportive of the bullish trend. MACD is still on a buy signal while relative strength remains impressive. Moving through the upper Bollinger band (top pane) for the fourth consecutive week was stupendous, but finishing with an upside down doji means sellers took over on Friday.
At the midpoint of the second quarter the stock market is up an astounding amount, which just cannot last or be repeated — or can it?
