Charting the S&P 500: Index Continues to Grind, but Money Is Moving
We’re seeing good action in some groups and wretched price moves in others.
You've reached your free article limit
You've read 0 of 1 free Pro articles.
We can certainly give the S&P 500 the benefit of the doubt based on price action. If this is sideways consolidation after a sharp run up then the index is doing it right.
It is tough to be content with the markets moving in place, but if we simply look outside the big index we’ll notice that certain groups are quite strong while others are weakening. That is called rotation, which is a healthy condition where funds are moving around from sector to sector. Out of software, into retail, or out of semiconductors and into staples. As long as the funds stay in the equity market then it can “slosh” around.
As for the weekly chart, the S&P ended another week in a rather tight range. A 200-point range is not huge for an index price at 7500; that is only about 2.7%.
With the all-time highs only 1.5% away from current levels we could see a sharp move up into the next few weeks. Earnings season is here again, and full of optimism and hope. As a trader once asked me, “Do you really want to be short during earnings season?”
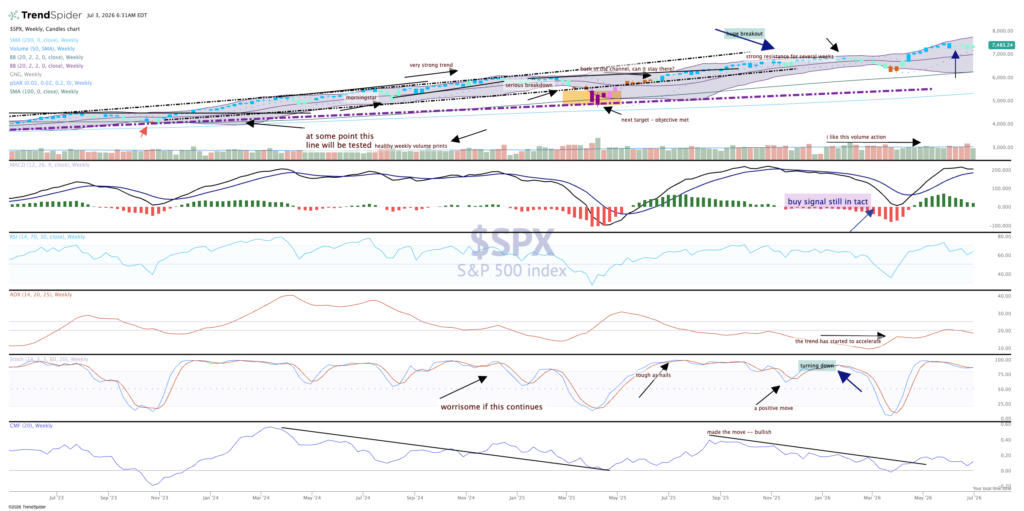
The indicators are still intact, with the MACD still on a buy signal and the stochastics (momentum) overbought. Money flow seems to be staying in place for now.
We’ll be watching the turnover the next few weeks to see if big money is being put to work at these current price levels.
