Chart of the Day: Some Bullish Qualities, But...
The stock is making a series of higher highs, higher lows, but it is getting extended.
You've reached your free article limit
You've read 0 of 1 free Pro articles.
A pretty nice chart formation for the newest member of TheStreet Pro Portfolio. Elastic N.V. ESTC has a very nice pattern of higher highs, higher lows — our textbook definition of an uptrend. While that might be very exciting for the bulls, we must temper the enthusiasm, realizing the stock is well below recent highs from August. But you have to start somewhere, and Elastic has made some great progress since that massacre in late summer.
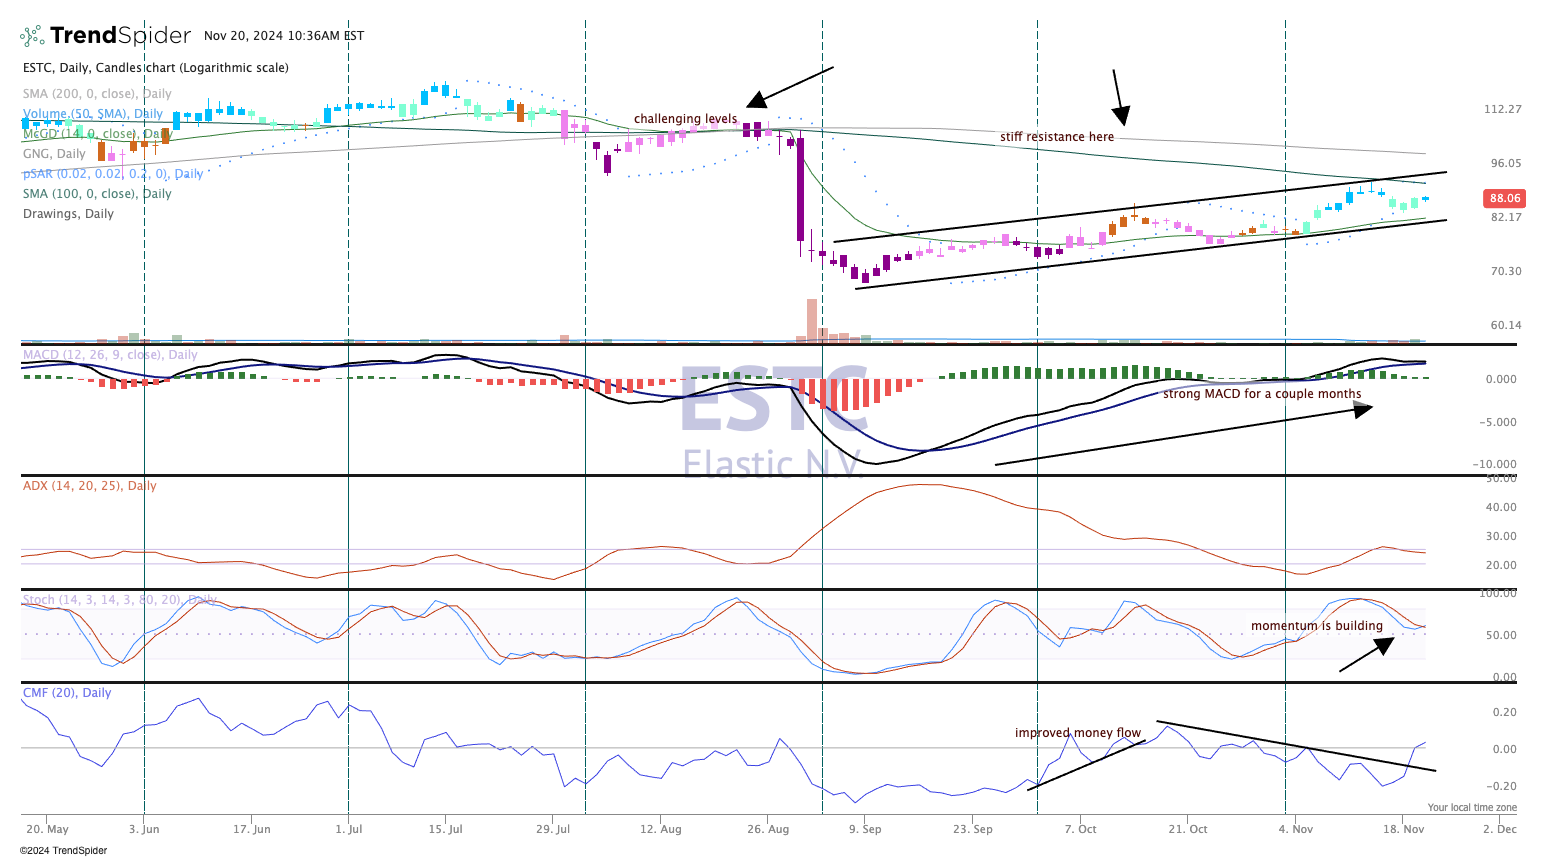
The company reports earnings on Nov. 21 after the close of trading. As mentioned, the chart looks pretty good here but price is backed up against some resistance, namely the 100-day moving average and then the 200-day moving average. Those levels may be difficult to rise above unless there is a nice push higher on volume or a gap above there. In that case, the stock has plenty of room to move back towards those August highs, let's call it $111.
Money flow came down gently but is moving back up, telling us institutions are getting back on board Elastic. Momentum is building in the stock as the stochastics have turned back upward, and we like the very long buy signal in the MACD (moving average convergence/divergence).
We rate Elastic a one in TheStreet Pro Portfolio.
More Pro Portfolio:
- We're Buying More Shares of This Technology Position
- Weekly Roundup: Powell and Inflation Toss Cold Water on the Post-Election Rally
- Updating Our Table for Panic, Potential Pickup Points
At the time of publication, TheStreet pro Portfolio was long ESTC.
