Chart of the Day: Coty Is Showing Better Price Action
The stock still needs to show that relative strength is improving.
You've reached your free article limit
You've read 0 of 1 free Pro articles.
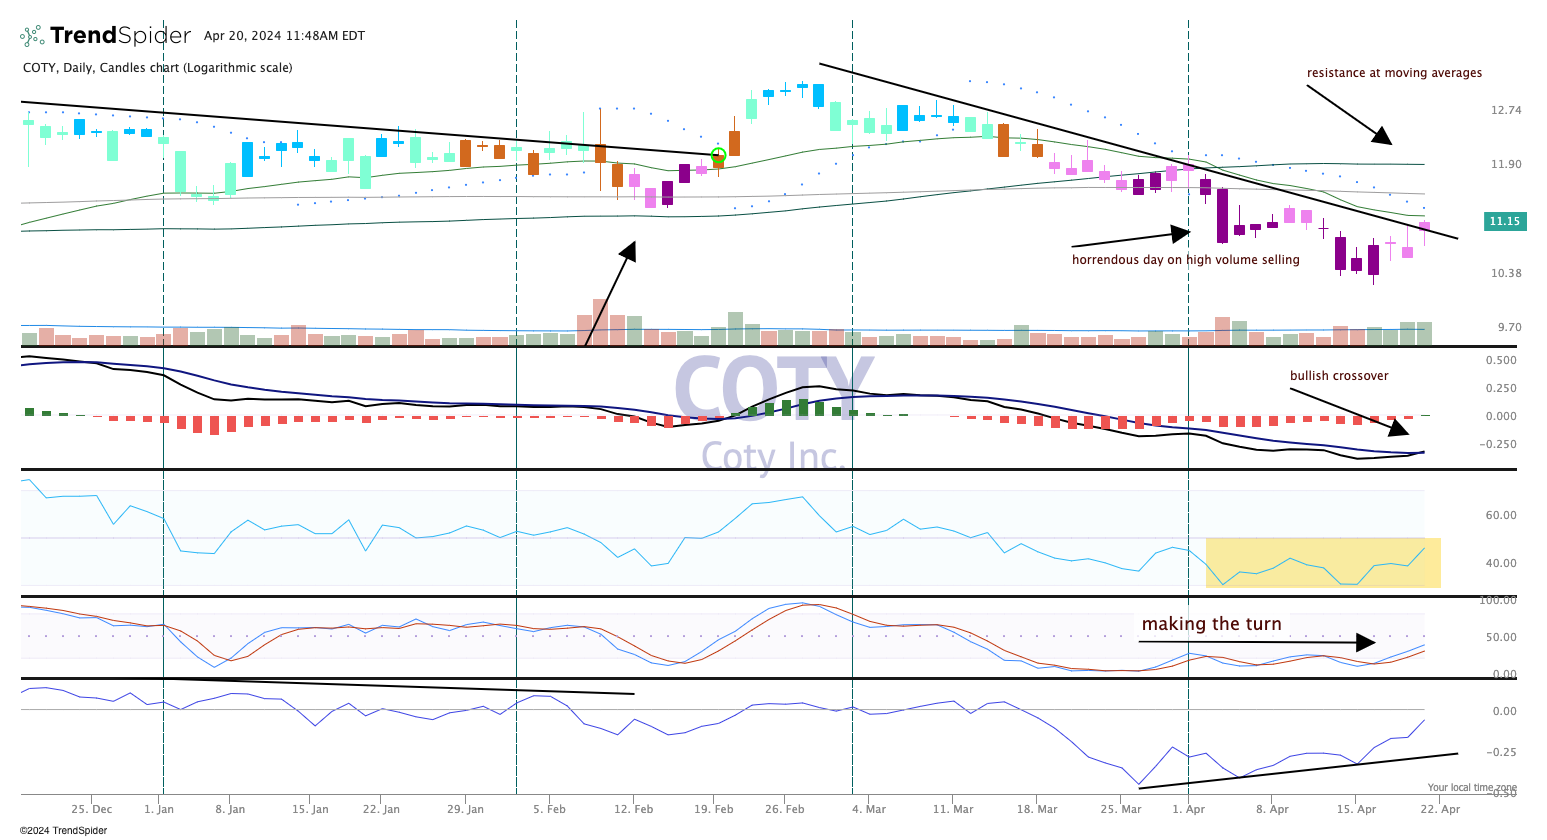
Coty COTY has shown some price improvement since that disastrous trading day in early April. Back then the stock was hit hard along with other cosmetic-related names on some pretty heavy selling volume.
That seems to have led to a bottom in the $10 area, and we've seen some better price action this past week.
Notice the candles changed from purple to pink, so it's still cautiously bearish.
We also see Coty moving above the downtrend line, but confirmation of this move is important. The ideal situation would be a higher low. In this case a close above the $10.55 area and then a move back up.
To view this chart in a separate window, click here.
The MACD (moving average convergence divergence) is crossing over slowly and now appears to be starting a buy signal, and that's a good sign for the bulls.
The nagging indicator is relative strength. When its been strong in the past its a terrific indicator of price strength versus the rest of the market. Money flow is also improved (bottom pane), as we see a series of higher highs, higher lows.
Stochastics have also made the turn higher. This price oscillator tells us how well the stock is performing on a closing basis. If you were looking to add shares in this name, right now would be a good time to do it, and this could be a nice low-risk entry point.
We rate Coty a One in TheStreet Pro portfolio, or 'buy at any time'.
At the time of publication, TheStreet Pro Portfolio was long COTY.
