While the Market Trades According to My Plan, Sentiment Makes a Shift
We got the bounce I expected, but a change in sentiment has me rethinking the next move.
You've reached your free article limit
You've read 0 of 1 free Pro articles.

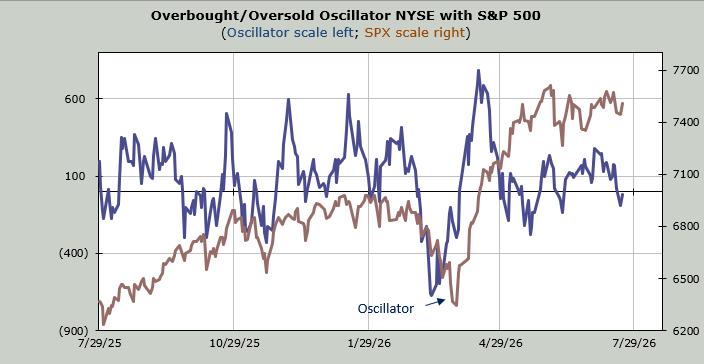
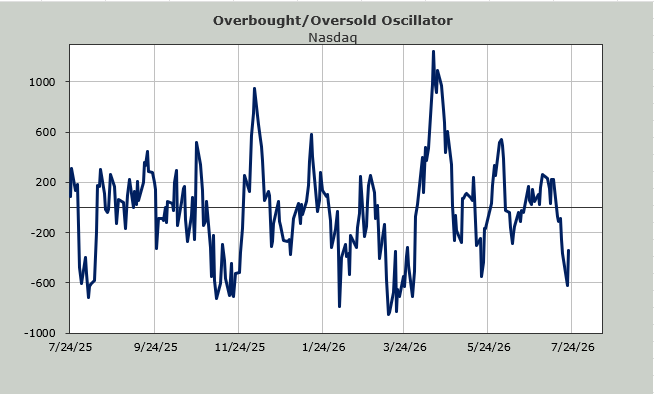
I like it when the market is oversold and sentiment lines up with it. For days now, I have said we’re getting oversold (Nasdaq), but sentiment is just not there. For that reason, I thought we were set up to rally early this week and take another trip back down.
Oftentimes, it is the rug pull after a rally that gets folks to change their sentiment. That was the setup I imagined in the tech arena, specifically the Semis. Bounce and back down.
On Tuesday, the bounce arrived. And breadth (the others) was terrible despite the more than one percent move in the Russell 2000. Okay, the plan is going well, I thought. Then, at the end of the day, as I collected the usual data, I saw the ISE call/put ratio slip under 1.0.
That doesn’t happen very often. This is mostly retail traders, but I take notice when they are buying more puts than calls, especially on a day where the most favored group is rallying (tech/semis). In fact, the last time it happened was on April 8th, about a week after the low (green arrow on the chart).
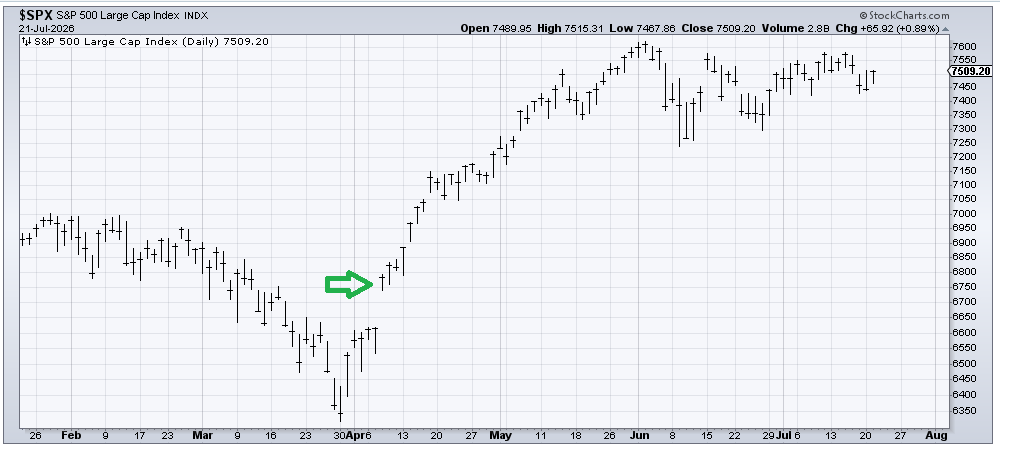
Did folks get that bearish in the last day or two? I mean, I thought Monday’s failure would have some concerned, but I did not expect it to be this drastic.
Then I saw that the ISE Equity call/put ratio had sunk to 1.24. We haven’t seen a reading that low since August of 2024 (green arrow).
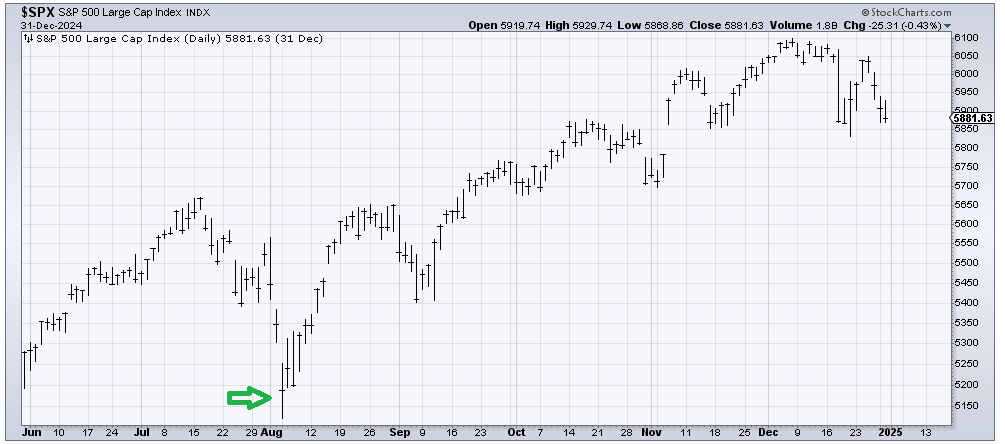
In fact, if you look at the chart of the S&P from 2024 (above), it has been my contention we’d get a rally like we saw in late July and then come down as we did in early August. Bounce and back down. That pattern tends to get folks bearish. It tends to get the VIX jumpy. It’s the scenario I like.
There is one more chart I want to show you. It’s the five-day moving average of the ISE Equity call/put ratio. I typically use the 21-day moving average for this indicator. I might even look at the ten-day moving average. I rarely look at or use the five-day moving average. Well, okay, I have no life, I look at the five-day moving average daily, but it’s rare for me to fuss over it.
This 1.60 area has been a low area for a few years now (current reading is 1.70). That green arrow, once again, was the scenario I envisioned: bounce and back down. But it feels to me like this change in sentiment among retail traders is important enough for us to pay attention to.
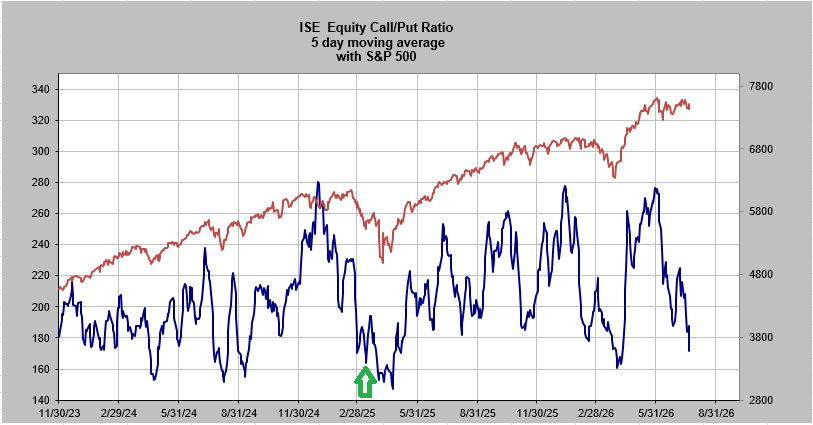
I am still looking for this bounce to come back down, but this is the first real change in sentiment I’ve seen. Well, aside from the anecdotal changes. Let’s see how this plays out and if Tuesday’s bearishness dissipates or if it stays with us.