Tech Investors Aren’t Used to This Kind of Selling
As the market drops, investors are becoming anxious. Should we be looking for a bottom?
You've reached your free article limit
You've read 0 of 1 free Pro articles.

There is certainly more bearishness out there today than there was on Monday. What else should we expect when the market opens up each day and gets sold? Tech stock investors are not used to their stocks getting sold for more than a day or so.
We see the angst in the chatter. We see it in the fact that the total put/call ratio has been over .90 for four straight trading days. And we see it in the fact that the ISEE call/put ratio for equities only slipped under 2.0 for the first time since early April.
I would remind you that this indicator slipped under 2.0 in early February and pretty much stayed there until early April, so when I note that it slipped under 2.0, I’m just noting the change in sentiment, not that sentiment is extreme.
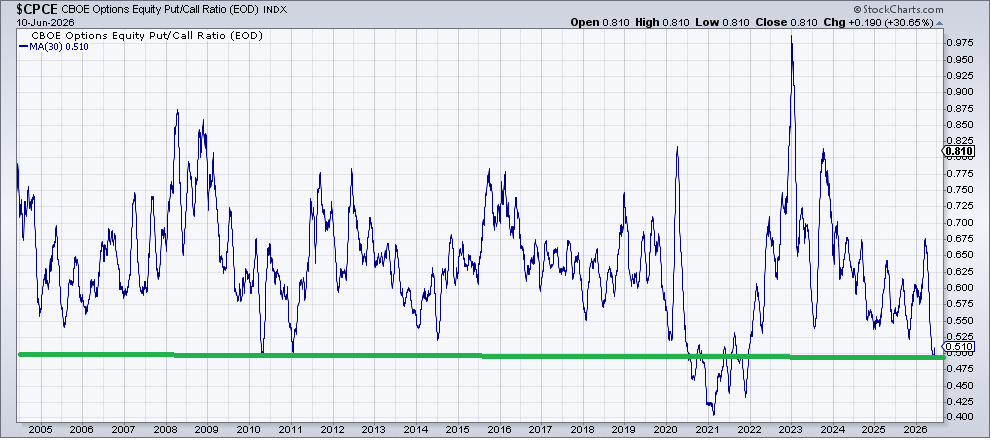
The equity put/call ratio has not gotten terribly high, though. It spent so many days under .60 that the 30-day moving average had fallen to .50, which you can see on this chart dating back two decades (when they started separating out the equity portion of the ratio) is really low. Only during COVID, when money was flowing like water, did it fall under this level.
But it’s finally bouncing as folks start to buy more puts.
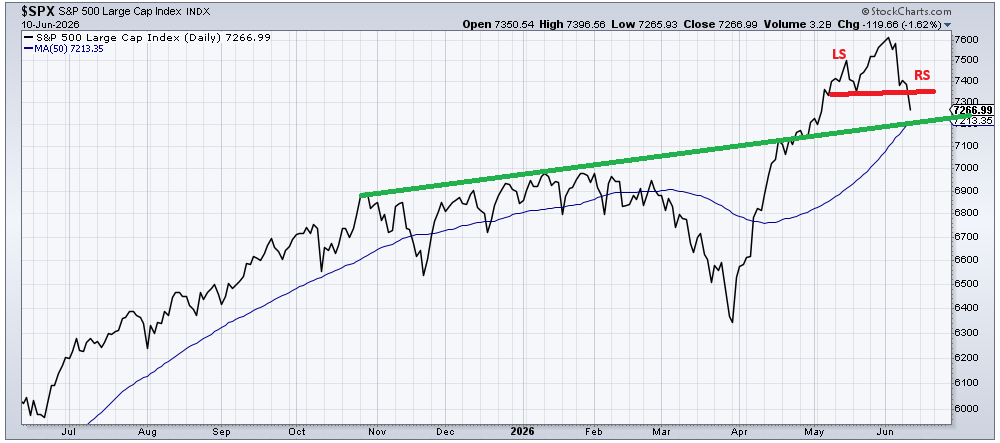
So we have sentiment getting more concerned. Perhaps they have seen the head and shoulders top that developed in the big cap indexes? Oh sure, the right shoulder is sort of quasi-moto style, but the neckline has been broken. It’s small and measures into the 7100-7150 area. Notice the support line that I have drawn in comes in right near the 50-day moving average. So there is a lot happening not far down from here.
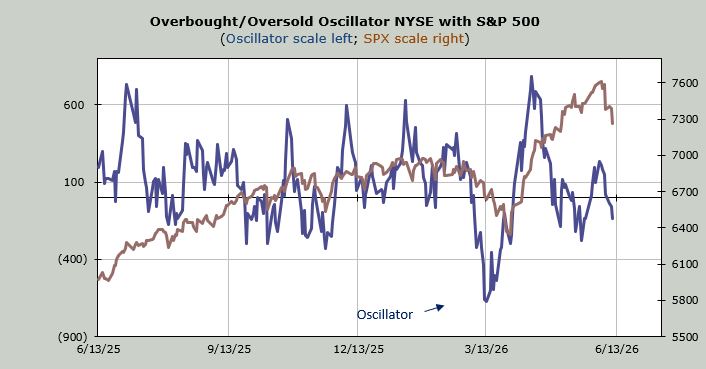
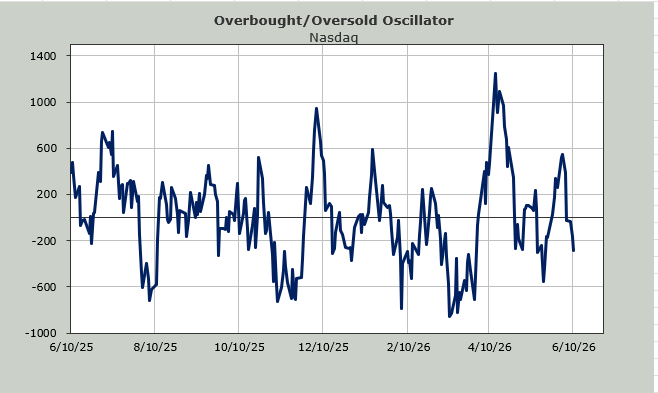
I expect we will be back to a short-term oversold condition early next week. I would love it if the VIX can get jumpy between now and then. I would love it more if we could see the put/call ratio with a super high reading (well over 1.0).
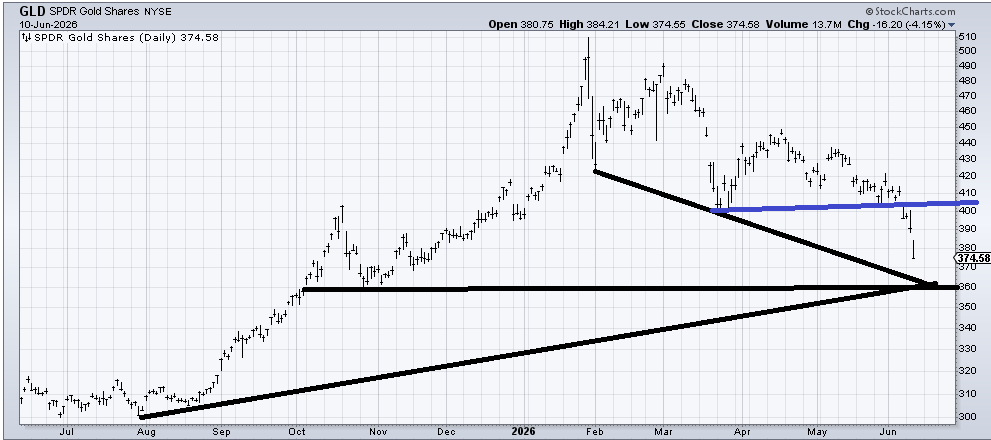
You know where we did see some serious selling? Gold. All of a sudden, it seemed to be the topic of the day. All sorts of charts were flying around showing this that or the other thing. For my part, I like to watch the chart and the Daily Sentiment Index (DSI). The DSI fell to 14 on Wednesday. Getting it to single digits or even 10 (recall last week we got the VIX DSI to 10 and you can see how that worked out) would be a great setup.
Finally, that top it broke down from (blue line) measures to the 360-370 area. You can see all the intersecting support lines down there as well. I think it’s time to start looking at GLD again, especially if we get one or more down days.