Key Market Data Doesn’t Seem to Care About the September Bears
Apparently, folks are scared of September. But some significant market readings would say otherwise.
You've reached your free article limit
You've read 0 of 1 free Pro articles.

I want to discuss sentiment but before I get to that, let me note that the statistics for Thursday’s rally weren’t anything to write home about. In fact, the Wednesday rally was better than Thursday’s.
Wednesday’s upside volume was 66% while Thursday’s was 64%. That might not sound like a big deal but point wise, the S&P was up more than double the points on Thursday versus Wednesday. So the upside volume should have expanded.
Breadth too was better on Wednesday than it was on Thursday.
Oh, surely there must have been good statistics on Nasdaq, right? I am sorry to report that Nasdaq had 75% of the volume on the upside on Wednesday and only 67% on Thursday. And the point gain was more than triple what it was on Wednesday.
That is what happens when the market is not broadening out. That is what happens when the “others” are lagging.
But it’s sentiment that has me fascinated. There is so much chatter about how negative folks are. Apparently, they are scared of September. And of course everyone was on the broadening out train which has not been a good trade in the last three weeks.
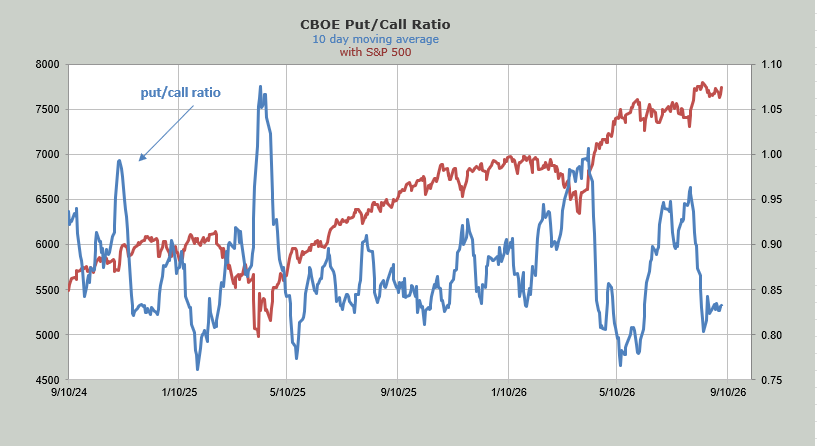
So, shouldn’t we see this bearishness in the data? Shouldn’t the put/call ratio be rising? Thursday’s put/call ratio was .79. Does that sound like folks are bearish? The 10-day moving average is near the bottom of the page. If folks are so scared of September, why don’t I see puts being bought?
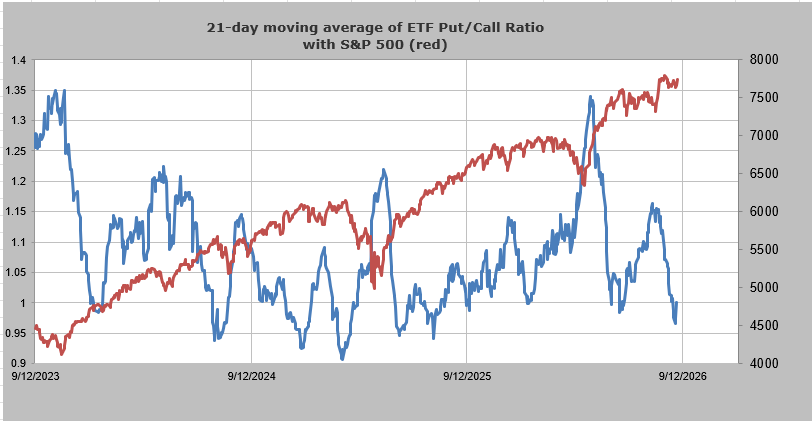
Shouldn’t we see the 21-day moving average of the put/call ratio for ETFs closer to the top of the page than the bottom if everyone is so prepped up for what might come in September?
Last week, we saw the NAAIM folks increase their exposure to 102, putting them on margin. Then we promptly got three down days and this week they have reduced their exposure to 84. OK, that makes sense to me.
The folks at AAII haven’t been this bullish in seven weeks. Yes, I wrote bullish. The bulls are now nearly 40%, the highest since mid July. I thought everyone was bearish.
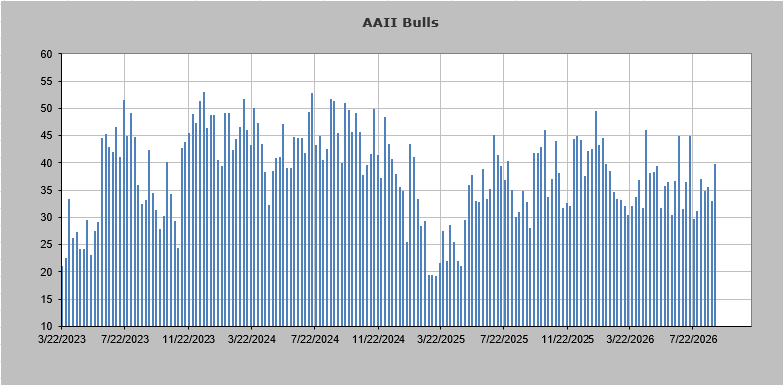
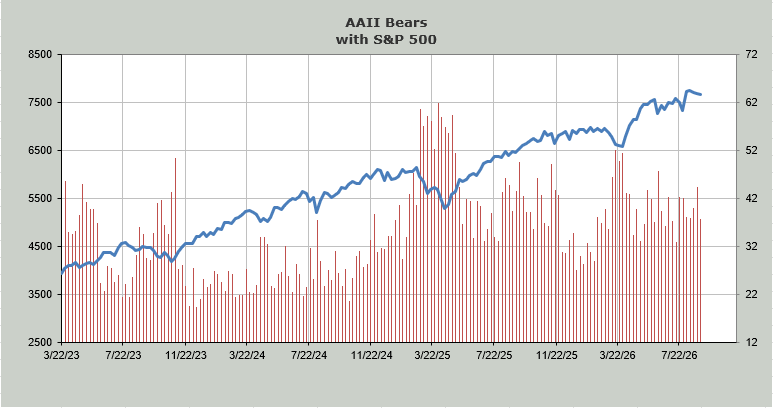
The bears fell as well, but they are just back to where they were three weeks ago. Yet this is the first week in seven weeks that there are more bulls than bears.
It is at this point that I should note that I still think this survey is mostly garbage unless it is confirmed by other indicators, but I am using it because folks who have been cautious or bearish for seven weeks all of a sudden turned bullish — this week of all weeks? It makes no sense, especially when the chatter is that everyone is so cautious.
What does make sense is that the Daily Sentiment Indicator (DSI) for the VIX now sits at 13, the same reading we had on August 27, just before we had three quick down days. Let’s see if the Employment Report can get that VIX DSI reading under 10.