Job Openings, Quits, and Layoffs All Fall in August
A collapse in small business openings sees headline openings fall to the least since March of this year, but layoffs drop to the least since March 2025.
You've reached your free article limit
You've read 0 of 1 free Pro articles.

US JOLTS Job Openings, August: 7.079 million (estimate 7.228 million; previous 7.271 million; previous revised 7.335 million)
— Job Openings Rate: 4.3% (estimate 4.4%; previous 4.4%)
— Quits Level: 3.066 million (estimate 3.109 million; previous 3.056 million; previous revised 3.089 million)
— Quits Rate: 1.9% (estimate 1.9%; previous 1.9%)
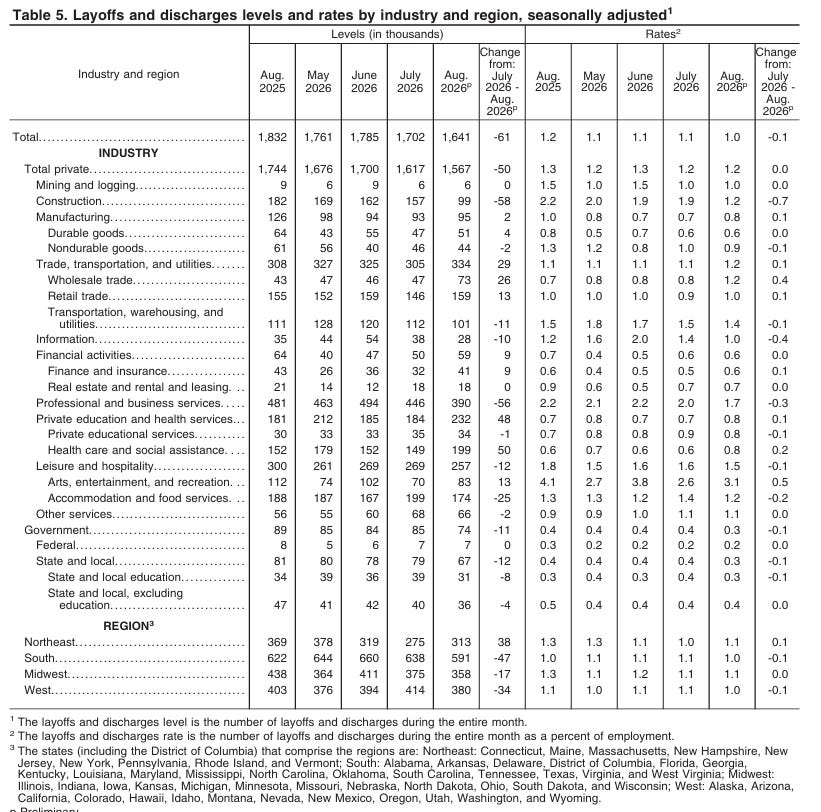
— Layoffs Level: 1.641 million (estimate 1.650 million; previous 1.666 million; previous revised 1.702 million)
— Layoffs Rate: 1.0% (estimate 1.0%; previous 1.0%; previous revised 1.1%)
Executive Summary
- August job openings fell 256,000 to 7.079 million, the least since March of this year, a miss against the 7.228 million estimate, with the openings rate down a tenth to 4.3%. The decline was more than accounted for by a drop in openings at firms with one to nine employees, which collapsed 335,000.
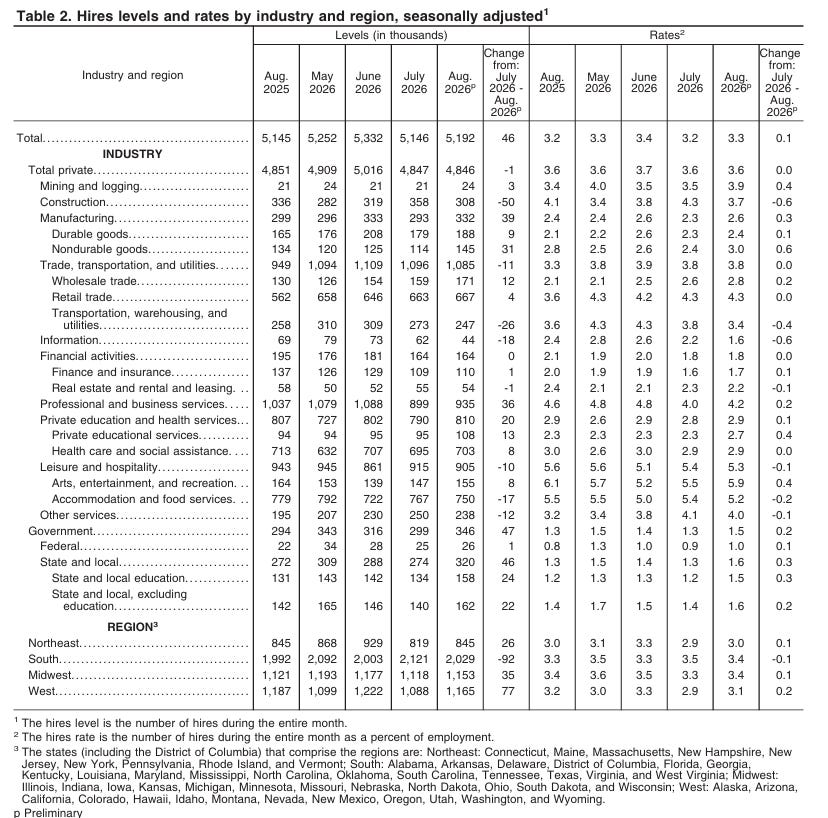
- Hires rose 46,000 to 5.192 million, but the entire gain came from government (+47,000) while private-sector hires were down 1,000.
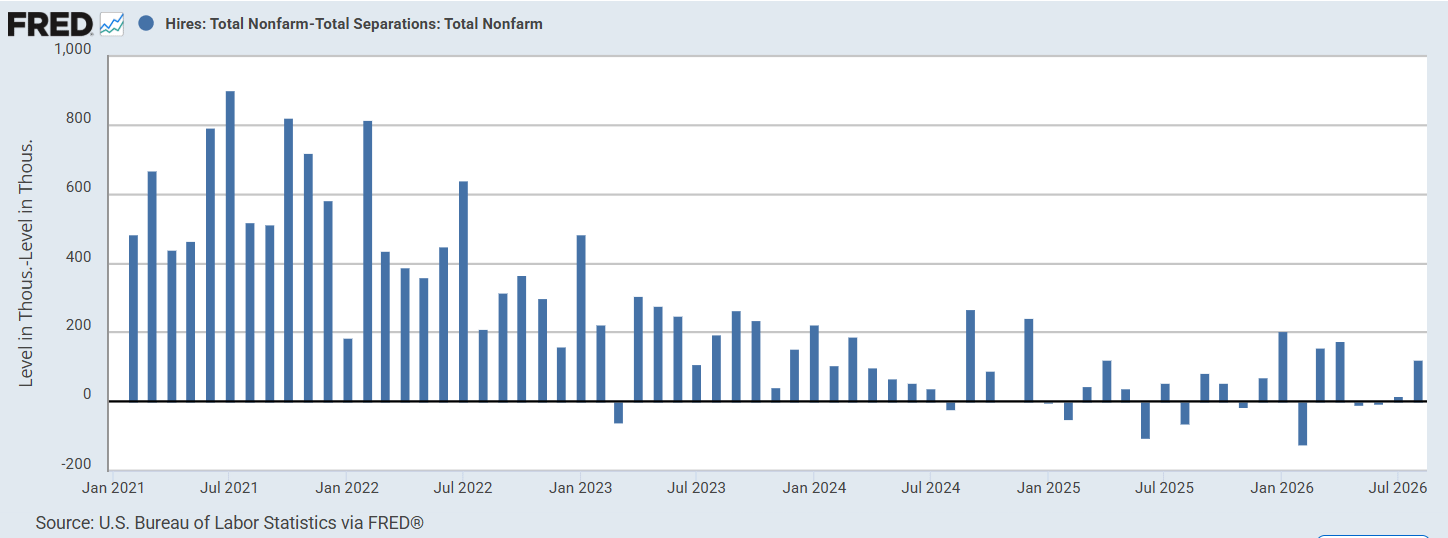
- Hires minus separations — an employment proxy — swung to +122,000 the best since April.
- Quits fell 23,000 to 3.066 million, below the 3.109 million estimate, with the quits rate unchanged at 1.9%, the joint least since June 2020.
- Layoffs fell 61,000 to 1.641 million, the least since March 2025, with the layoffs rate down a tenth to 1.0%, the joint lowest since June 2024, even as health care layoffs jumped 50,000 (health care openings also fell 115,000).
Now let’s take a deeper look with a lot more detail and charts.
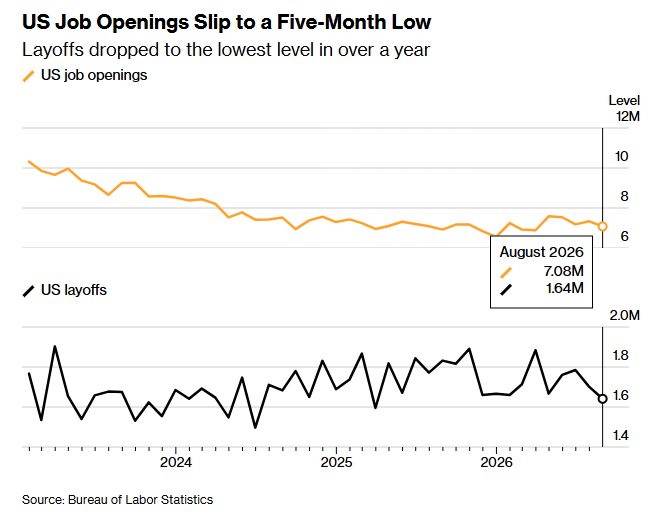
Numbers reported are m/m unless otherwise indicated. Also as most people report on these seasonally adjusted, I do as well, but note that can cause issues with seasonal distortions. The note goes through openings, then hires, then quits, then layoffs.
Job Openings
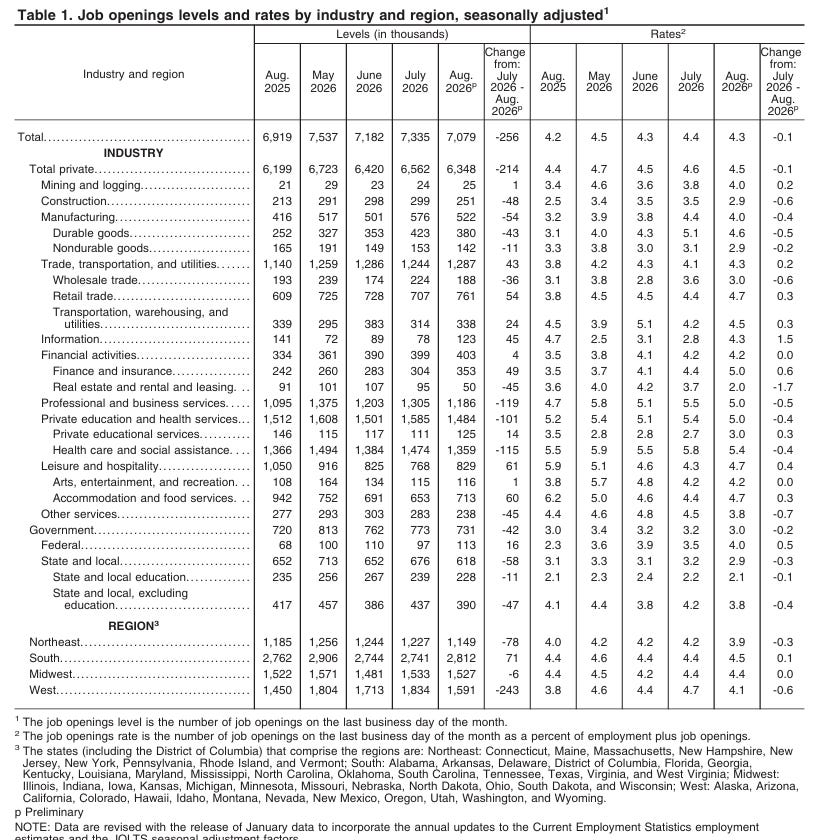
August job openings fell 256,000 to 7.079 million, the least since March of this year, after July was revised up 64,000, well below the 7.228 million estimate. While well below the March 2022 peak of 12.182 million, the level remains modestly above January 2020’s 7.124 million and solidly above the 6.550 million in December 2025.
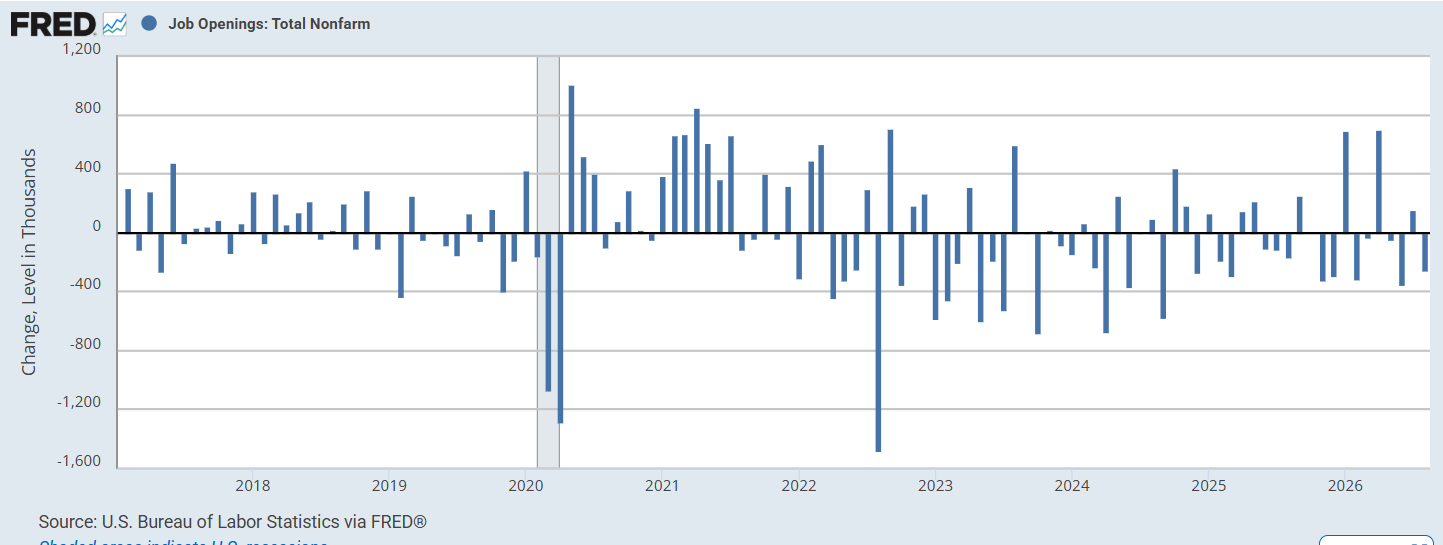
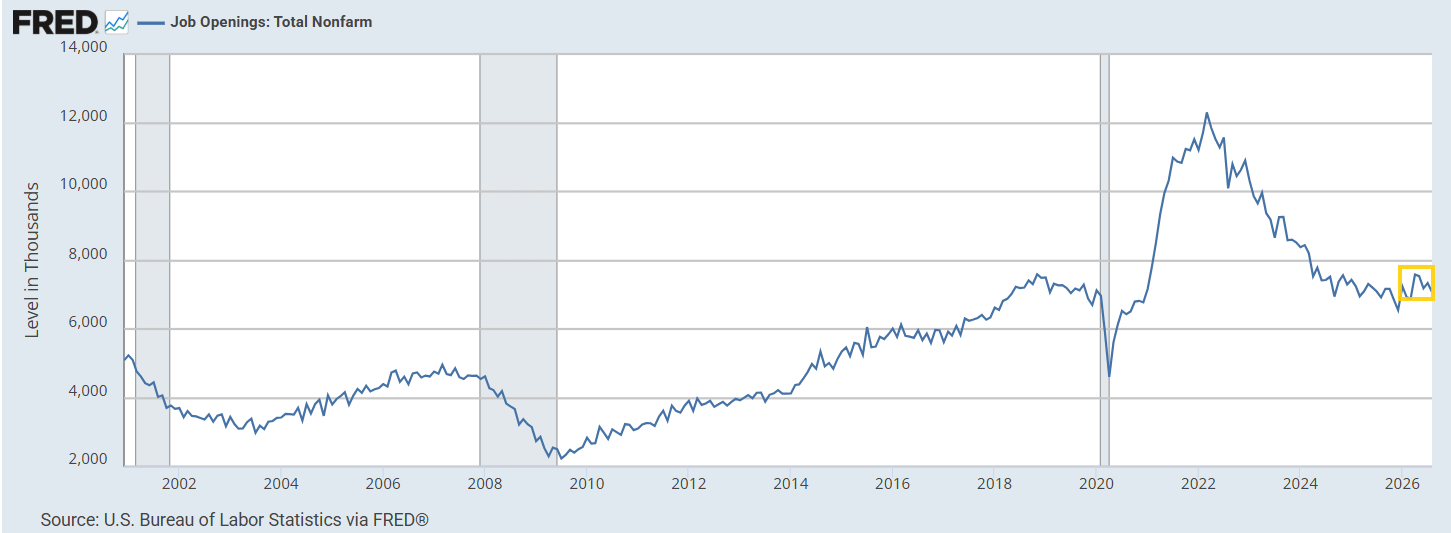
The headline decline was more than accounted for by a drop in openings at firms with one to nine employees, which collapsed 335,000, pushing that cohort’s openings rate (openings as a percentage of employed+openings) from 6.0% to 4.3%. The overall openings rate fell a tenth also to 4.3%.
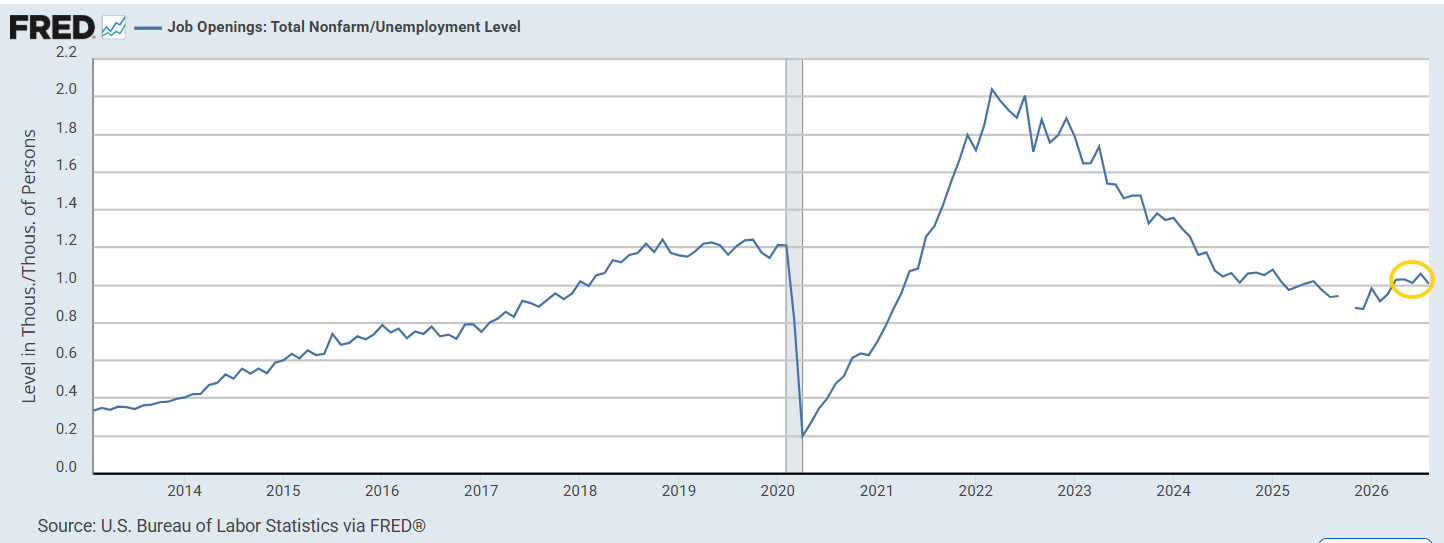
The ratio of openings to unemployed workers was 1.00, against the 2.04 peak in 2022 and 1.21 in January 2020 (chart).
Professional and business services led the decline at down 119,000, followed closely by health care and social assistance at down 115,000 — taking private education and health services down 101,000 overall. Construction fell 48,000, manufacturing 54,000 (durable goods down 43,000), other services 45,000, real estate and rental and leasing 45,000, and wholesale trade 36,000. Government fell 42,000, driven by state and local excluding education at down 47,000.
Offsetting those, leisure and hospitality rose 61,000 (accommodation and food services up 60,000), retail trade 54,000, finance and insurance 49,000, and information 45,000. Federal government openings rose 16,000.
Hires
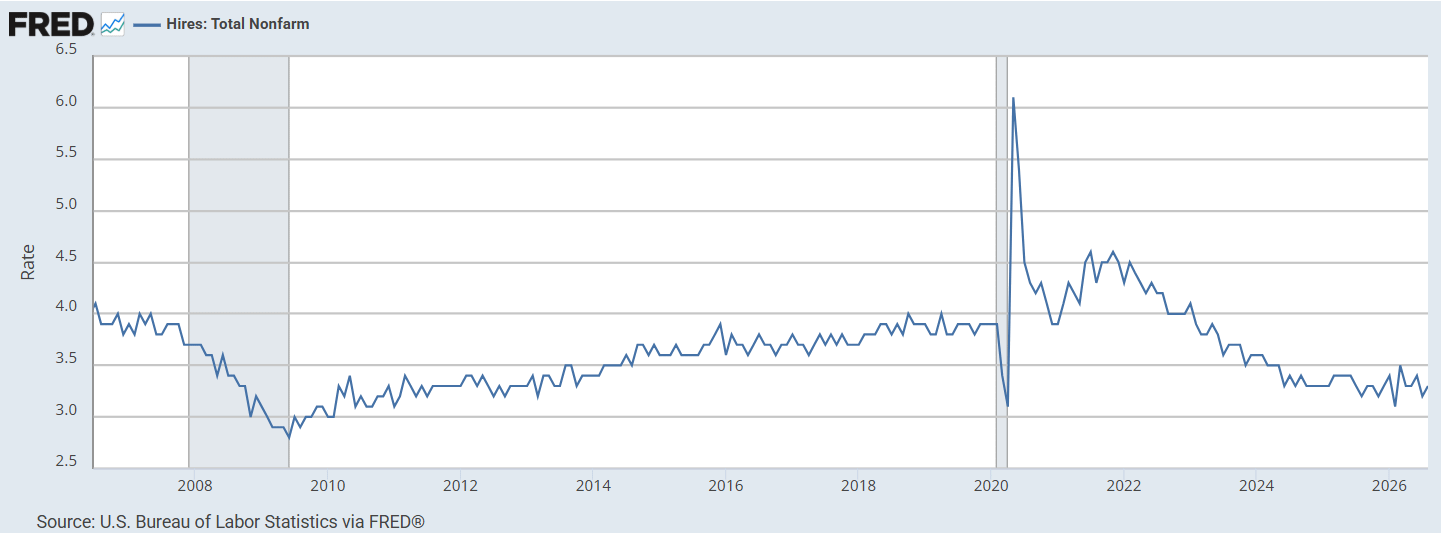
Hires rose 46,000 to 5.192 million after July was revised up 92,000 to 5.146 million (but still was -186,000 in July), remaining in its range over the past year.
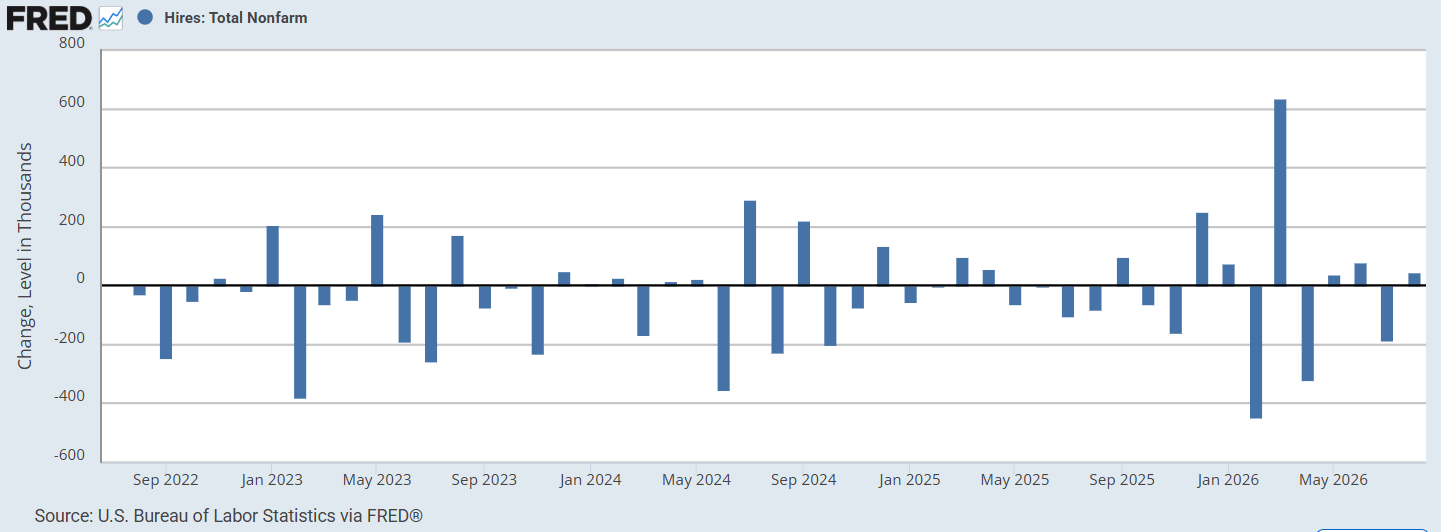
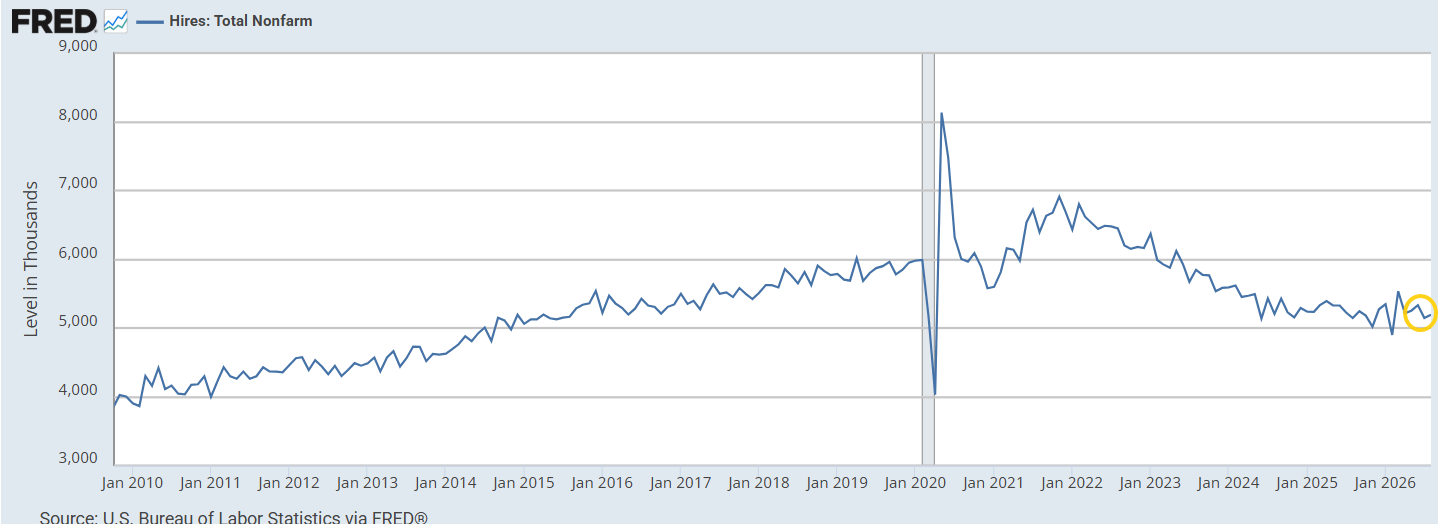
The hires rate (hires as a percentage of employed) rose a tenth to 3.3%.
The entirety of the gain though came from the government sector: private-sector hires were down 1,000, while government was up 47,000 led by state and local at +A46,000. Within that, state and local education added 24,000 and state and local excluding education 22,000.
On the private side, manufacturing rose 39,000 (nondurable goods up 31,000), professional and business services 36,000, private education and health services 20,000, and wholesale trade 12,000. Declines were led by construction at down 50,000, transportation, warehousing and utilities down 26,000, information down 18,000, and accommodation and food services down 17,000.
With separations at 5.070 million, hires minus separations — an employment proxy — swung to a positive 122,000, the best since April and revisions flipped July’s read to slightly positive at 18,000 rather than the negative 18,000 the original release implied.
Quits
Quits fell 23,000 to 3.066 million, below the 3.109 million estimate, also remaining in their range over the past year.
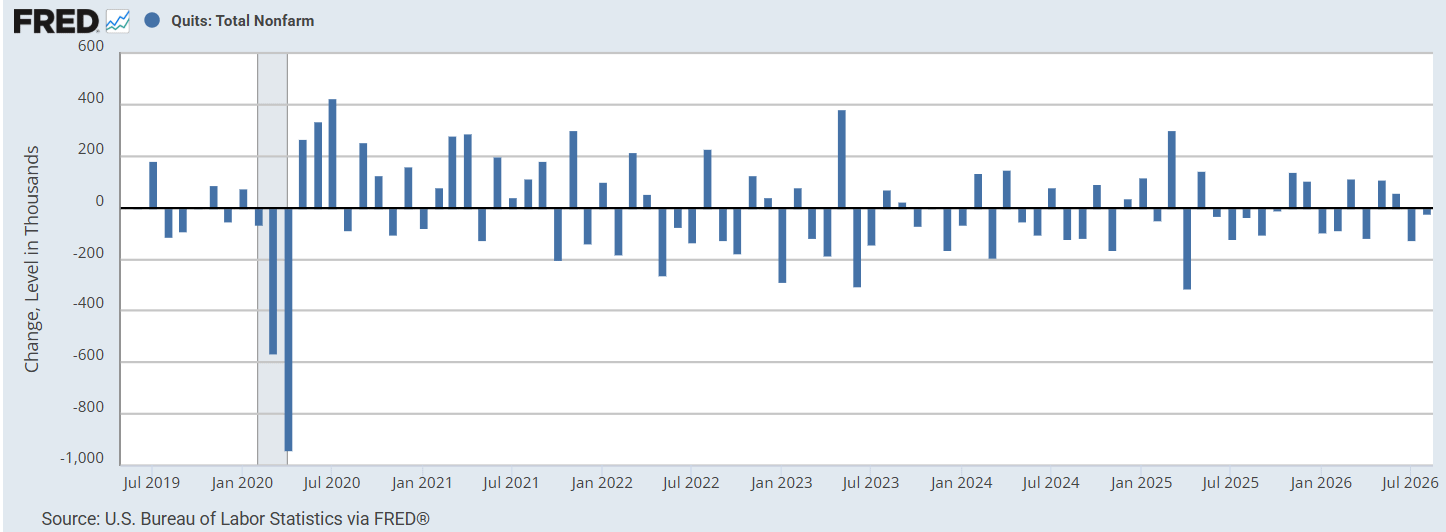
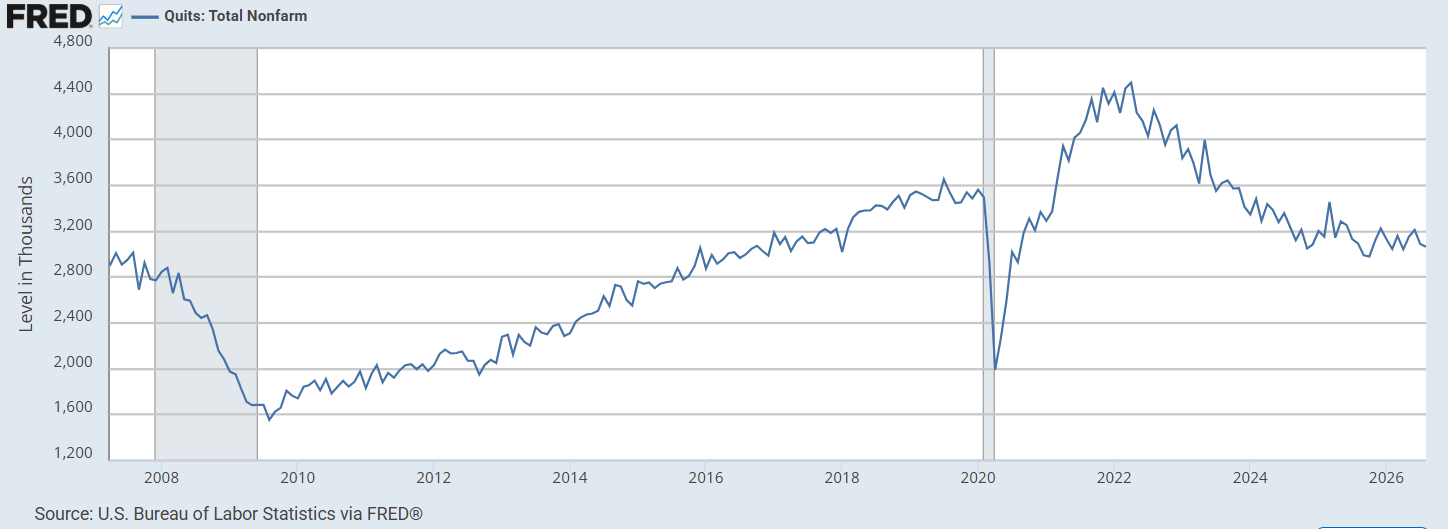
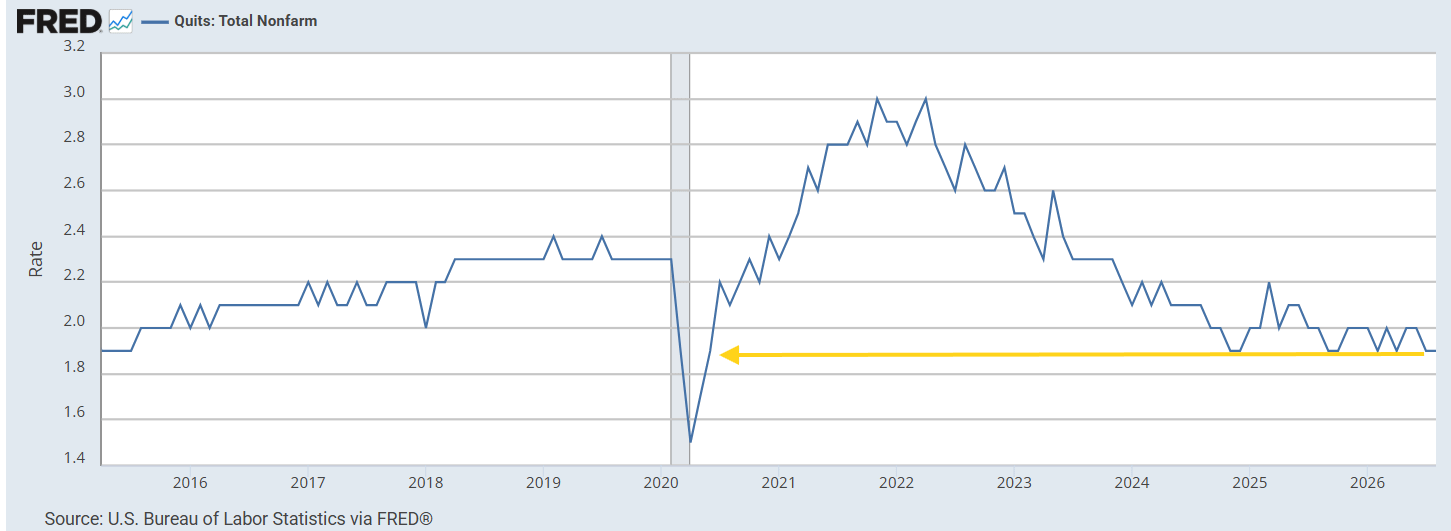
The quits rate (quits as a percentage of employed) was unchanged though at 1.9% the joint-least since June 2020, well below January 2020’s 2.3%, consistent with workers staying put rather than testing the market.
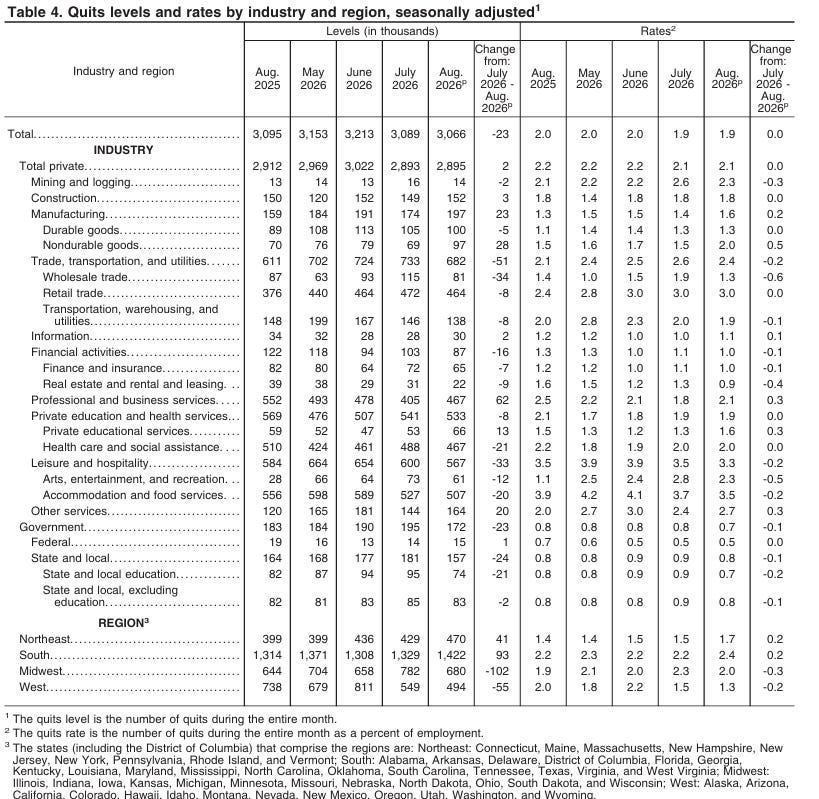
Professional and business services led gains at up 62,000, followed by nondurable goods manufacturing at up 28,000, other services up 20,000, and private educational services up 13,000. Declines were led by trade, transportation and utilities at down 51,000 (wholesale trade down 34,000), leisure and hospitality down 33,000, government down 23,000 (state and local education down 21,000), health care and social assistance down 21,000, and financial activities down 16,000.
Layoffs
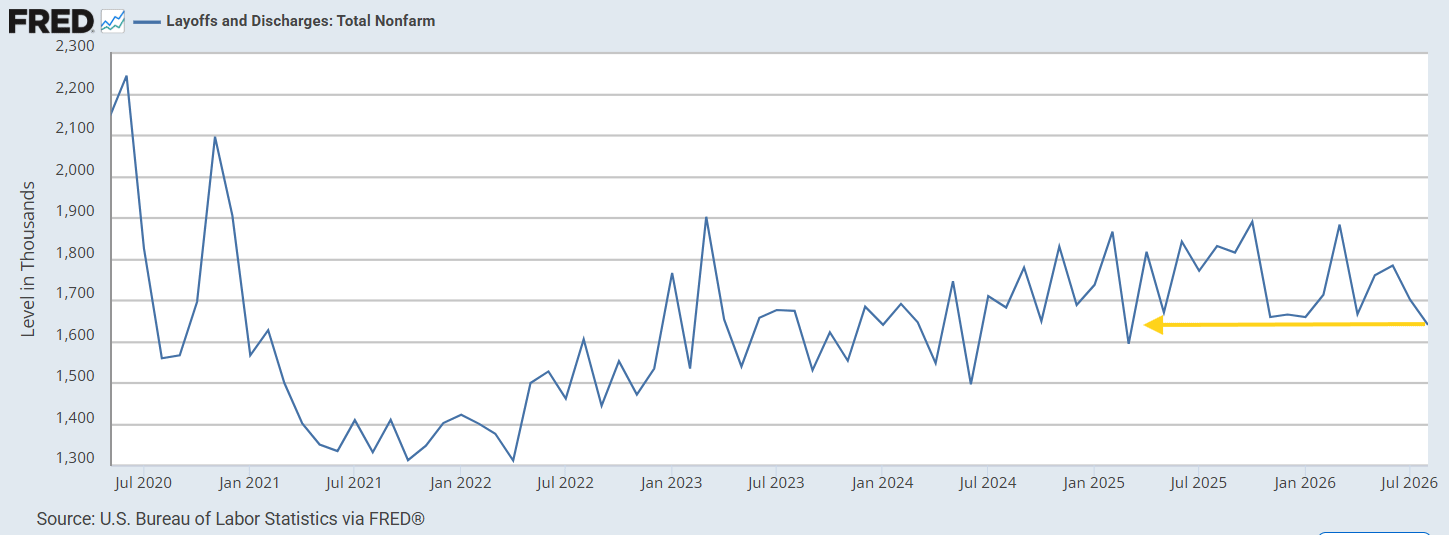
Layoffs fell 61,000 to 1.641 million, the least since March 2025, roughly in line with the 1.650 million estimate.
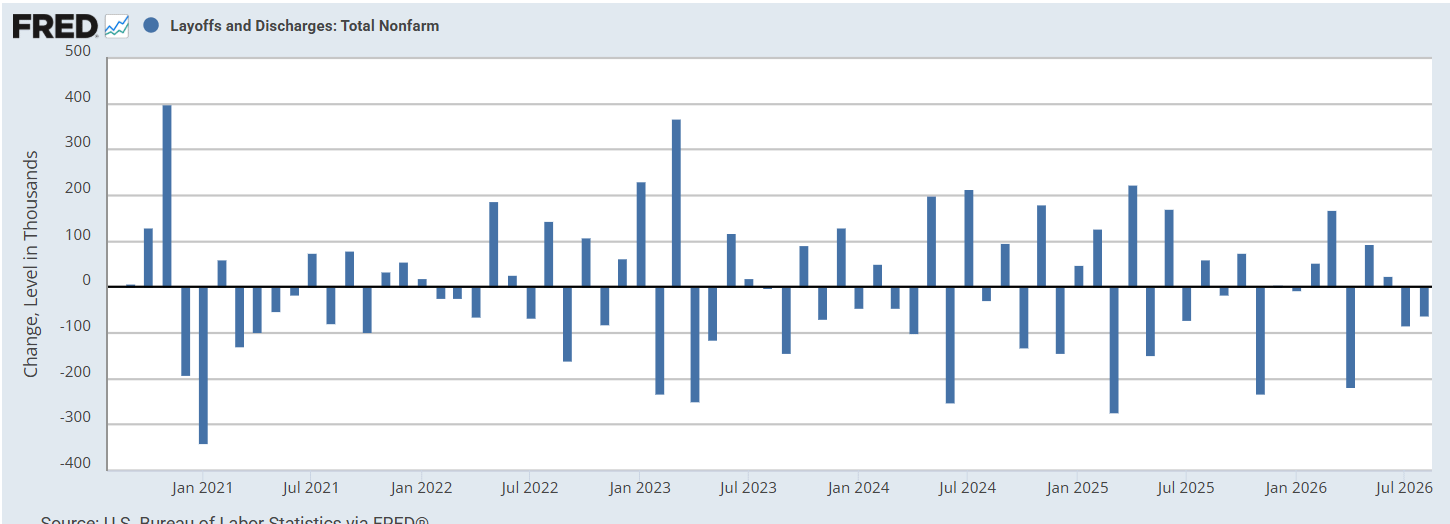
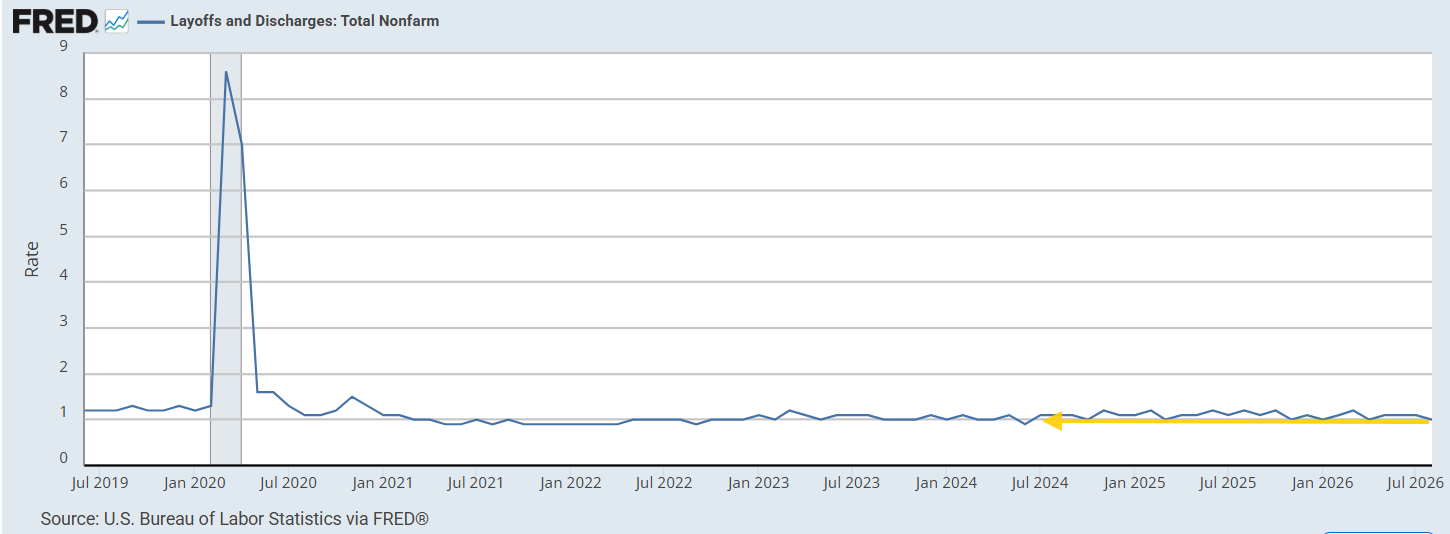
The layoffs rate (layoffs as a percentage of employed) fell a tenth to 1.0%, the joint lowest since June 2024, and vs 1.2% in January 2020.
Construction led the decline at down 58,000 and professional and business services at down 56,000, followed by accommodation and food services down 25,000, transportation, warehousing and utilities down 11,000, information down 10,000, and government down 11,000.
The standout on the other side was health care and social assistance, where layoffs jumped 50,000 to 199,000 — the same sector that saw openings fall 115,000. Trade, transportation and utilities rose 29,000 (wholesale trade up 26,000, retail trade up 13,000), arts, entertainment and recreation 13,000, and finance and insurance 9,000.