Climbing a Wall of Worry to Extreme Greed on the Fear & Greed Index
CNN's Fear & Greed Index hits Extreme Greed for the first time since March. What does it mean?
You've reached your free article limit
You've read 0 of 1 free Pro articles.
It’s not every day that CNN's Fear & Greed Index hits Extreme Greed. In fact, when I built it, the idea was for it to touch Extreme Greed or Extreme Fear no more than about twice a year.
Yesterday was one of those days. Fear & Greed closed at 75, the lower bound for Extreme Greed.
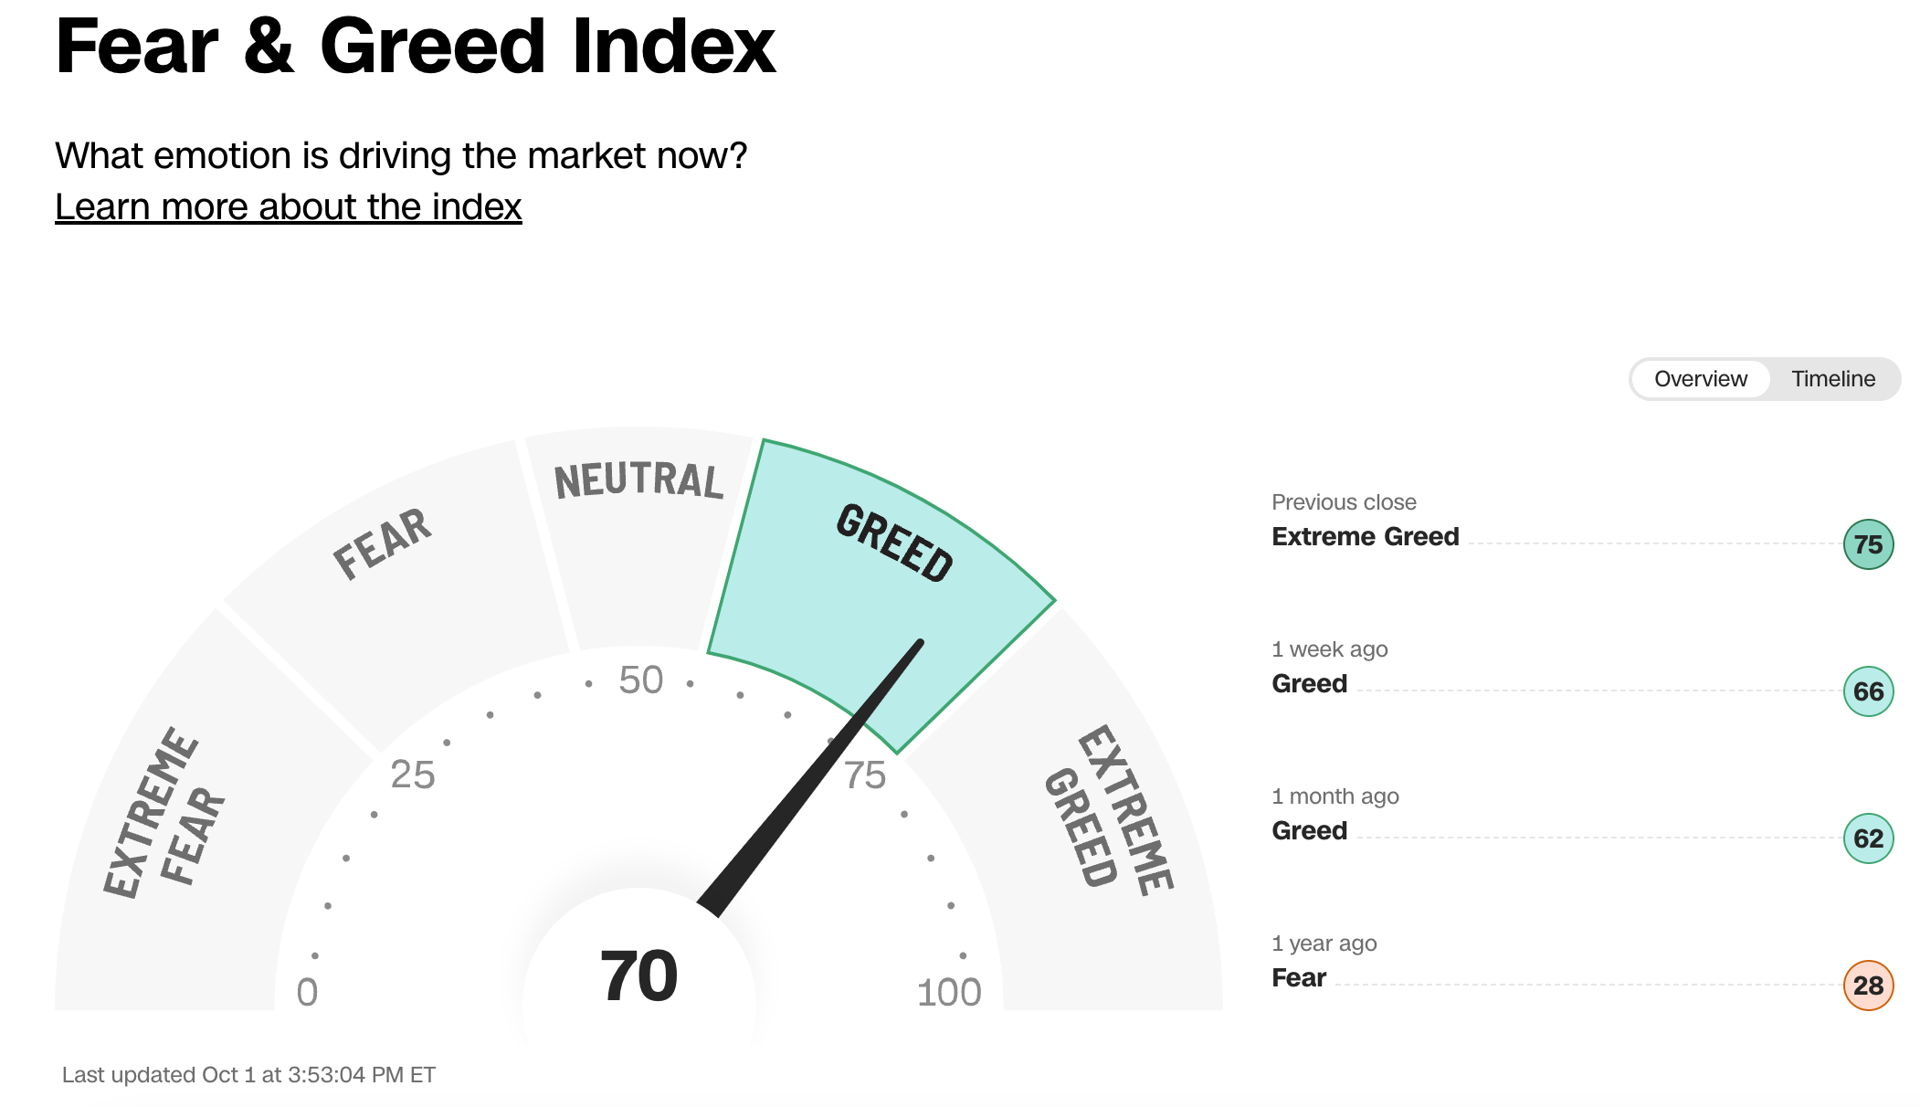
So, what does that mean? Should we sell everything and run for the hills?
Well, sometimes, Extreme Greed is good. This isn’t one of those times, but I don't think the sky is falling, either.
Extreme Greed is often good when the market is in the beginning stages of a new bull market (rocketing off of the lows) or in the midst of a strong bull market. Even then, there will usually be a brief decline before the resumption of the prevailing trend. 2023 was like that. Notice, too, that throughout 2023, Fear & Greed never really fell below 20. This indicated to me that the bull market was intact.
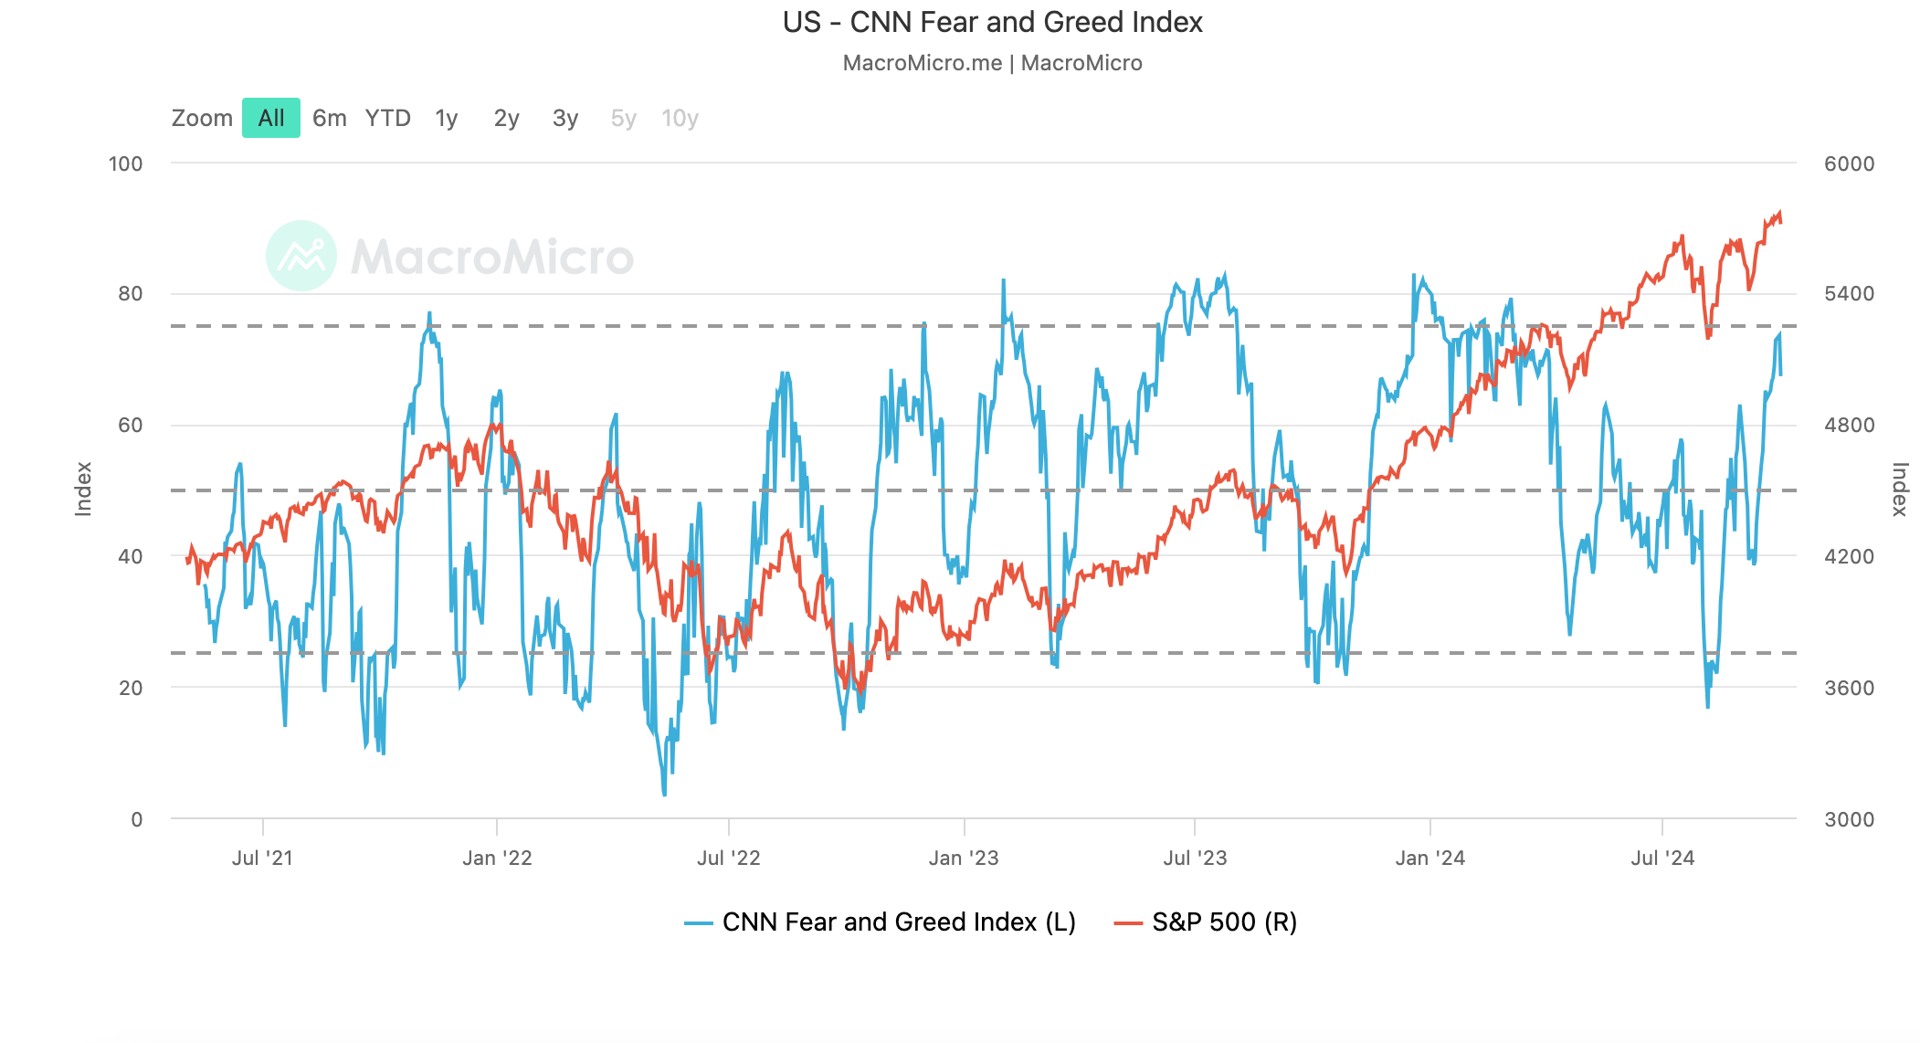
In 2024, Fear & Greed has had a difficult time getting into the Extreme Greed zone. The indicator spent much of the summer oscillating around neutral, even as stocks raced to new highs. That’s a divergence which often resolves to the downside.
But that didn’t happen. Instead, stocks have gone to new highs, and Fear & Greed has touched Extreme Greed.
Why? What drove that move?
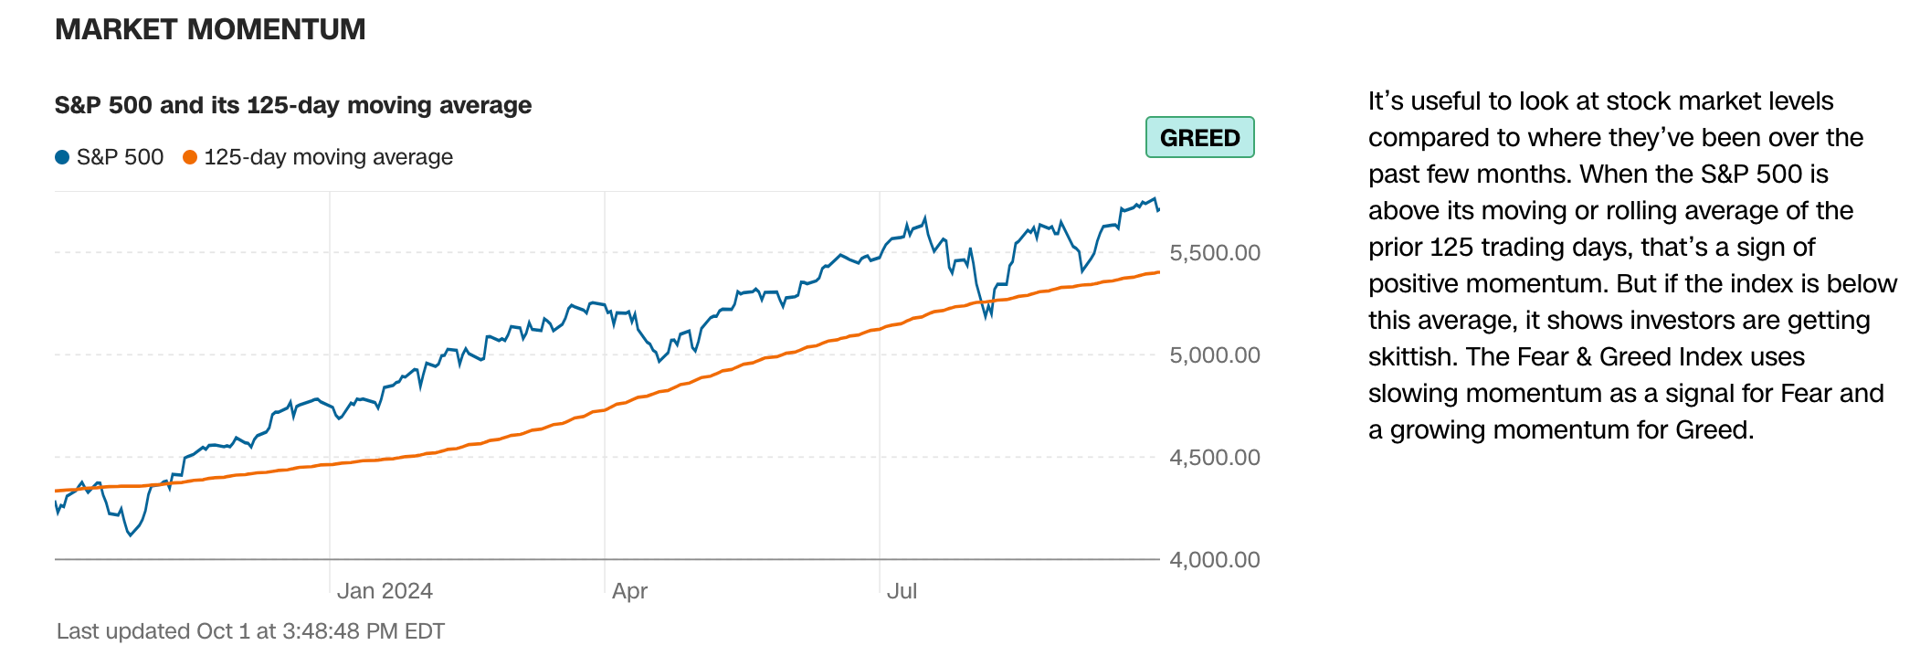
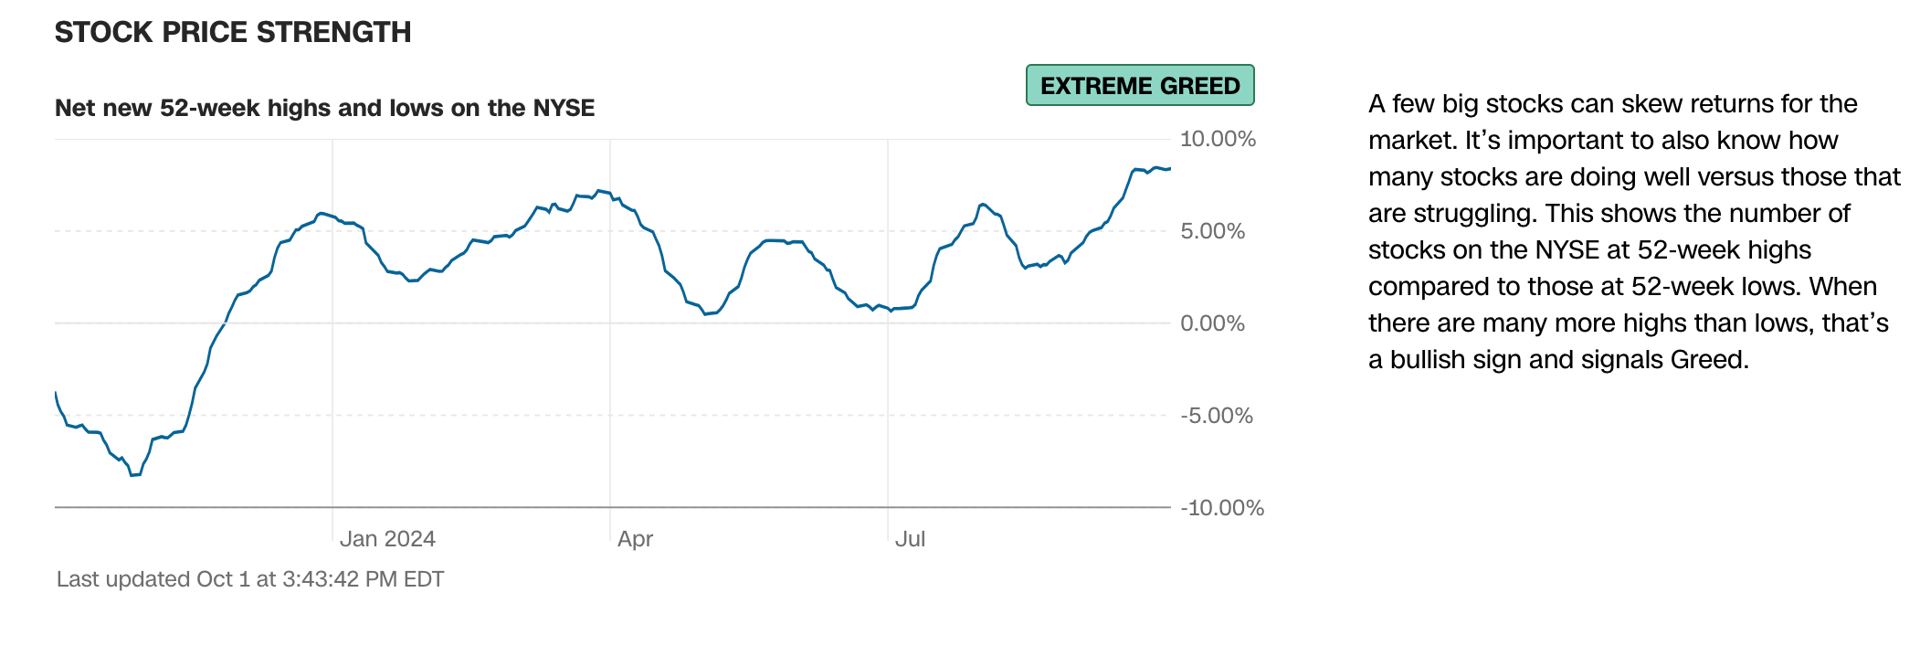
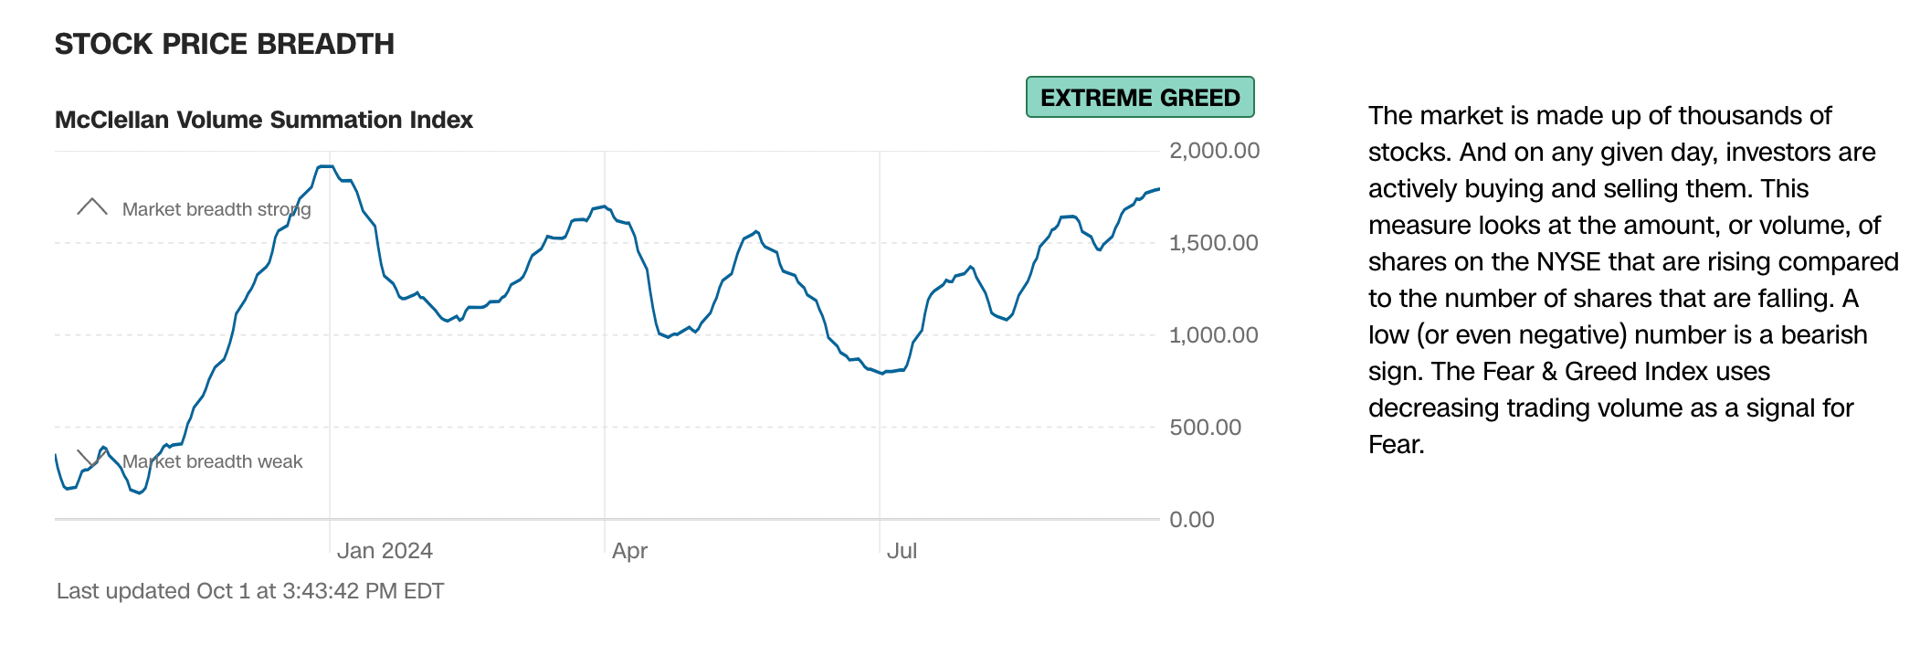
The Stock Market portions of the indicator, Market Momentum, Stock Price Strength, and Stock Price Breadth, are all strong. And that’s good! I like seeing breadth improving and with the move to new highs, the S&P 500 is definitely in an uptrend, marked by rising highs and rising lows.
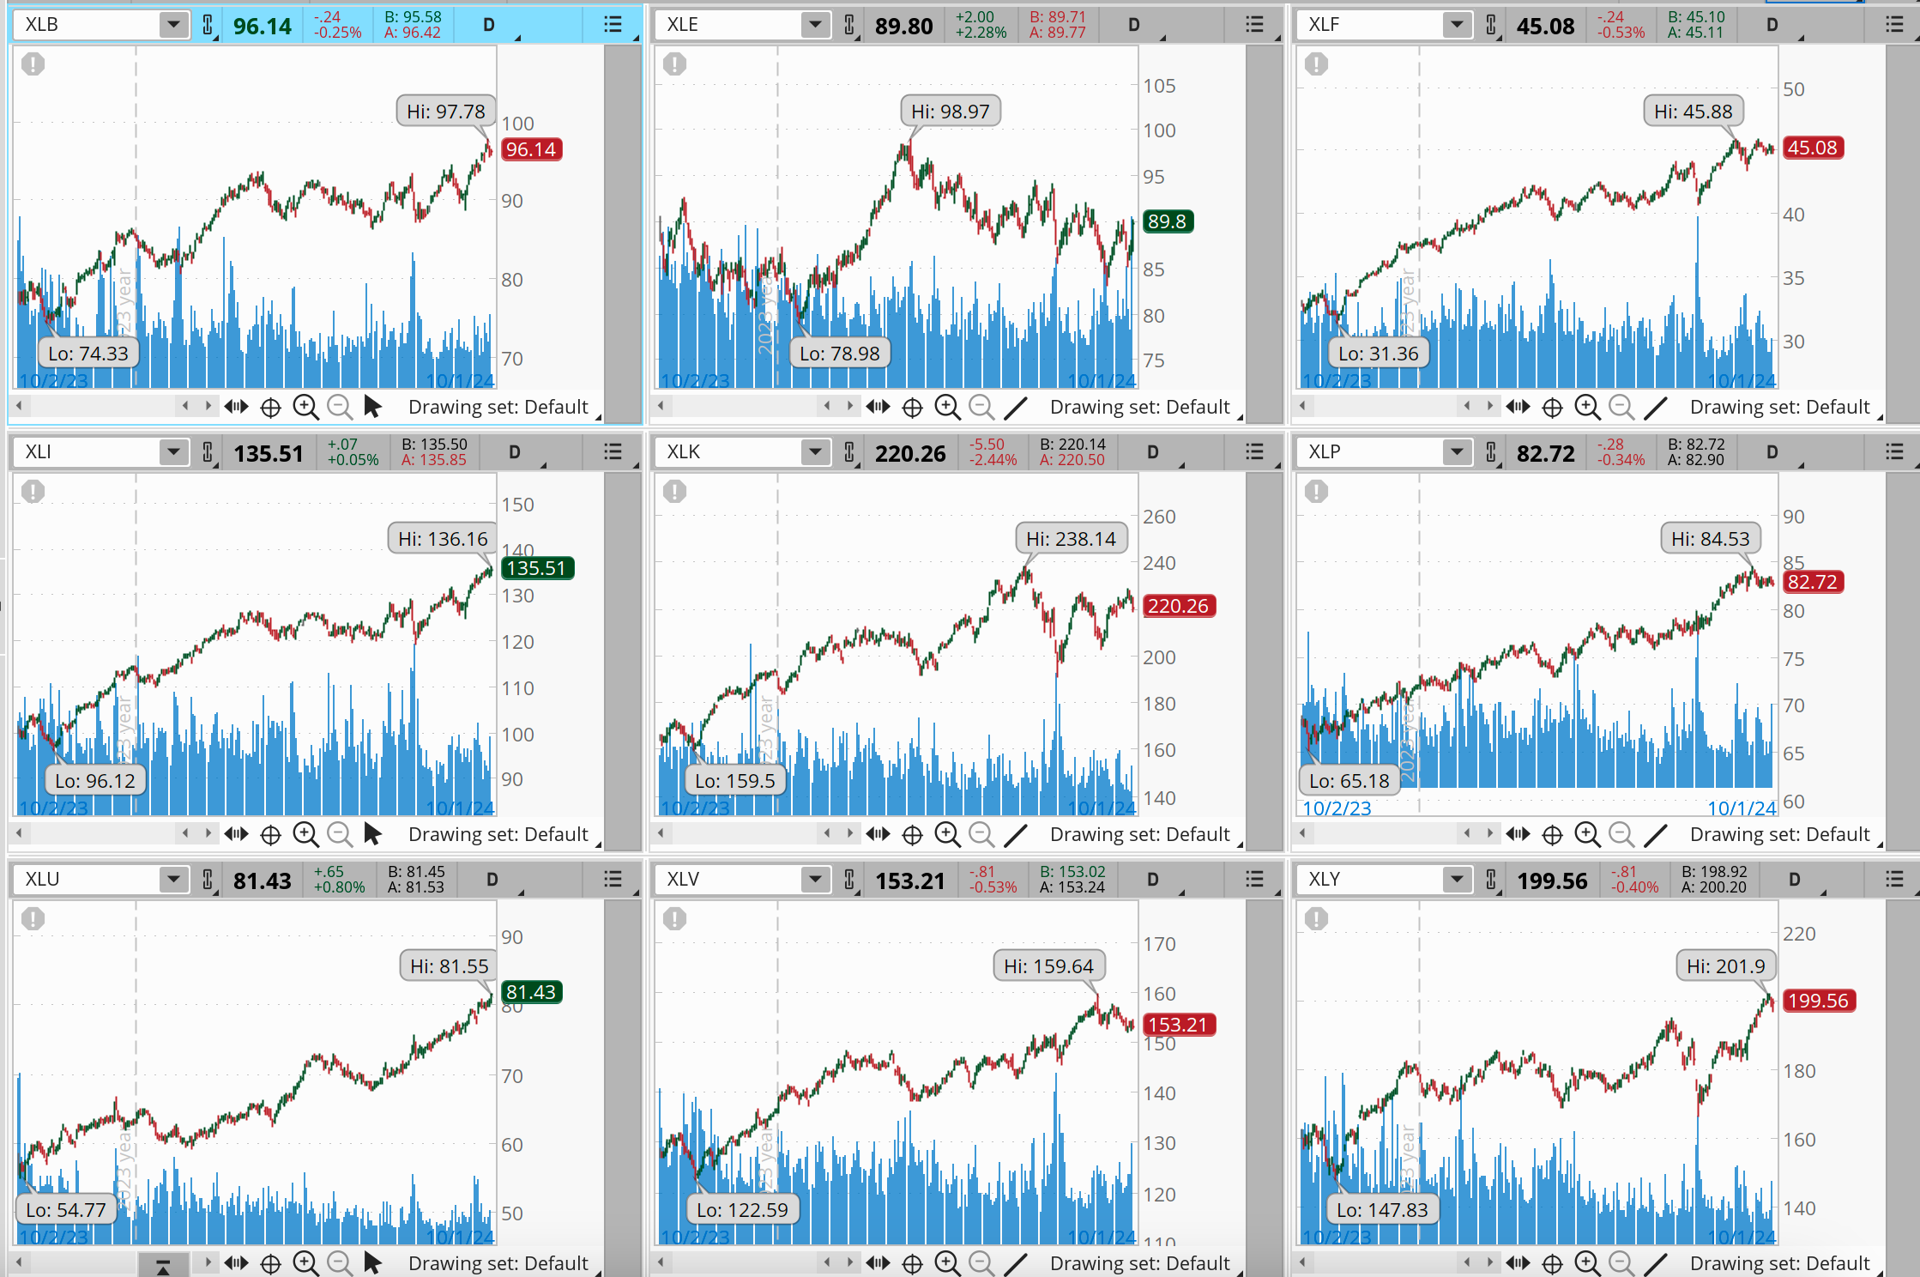
Looking at the sectors, a majority are moving higher. Six of the nine original sector SPDRs are near all-time highs. Tech is one of the laggards! So, there’s been lots of rotation and a broadening out of the bull market.
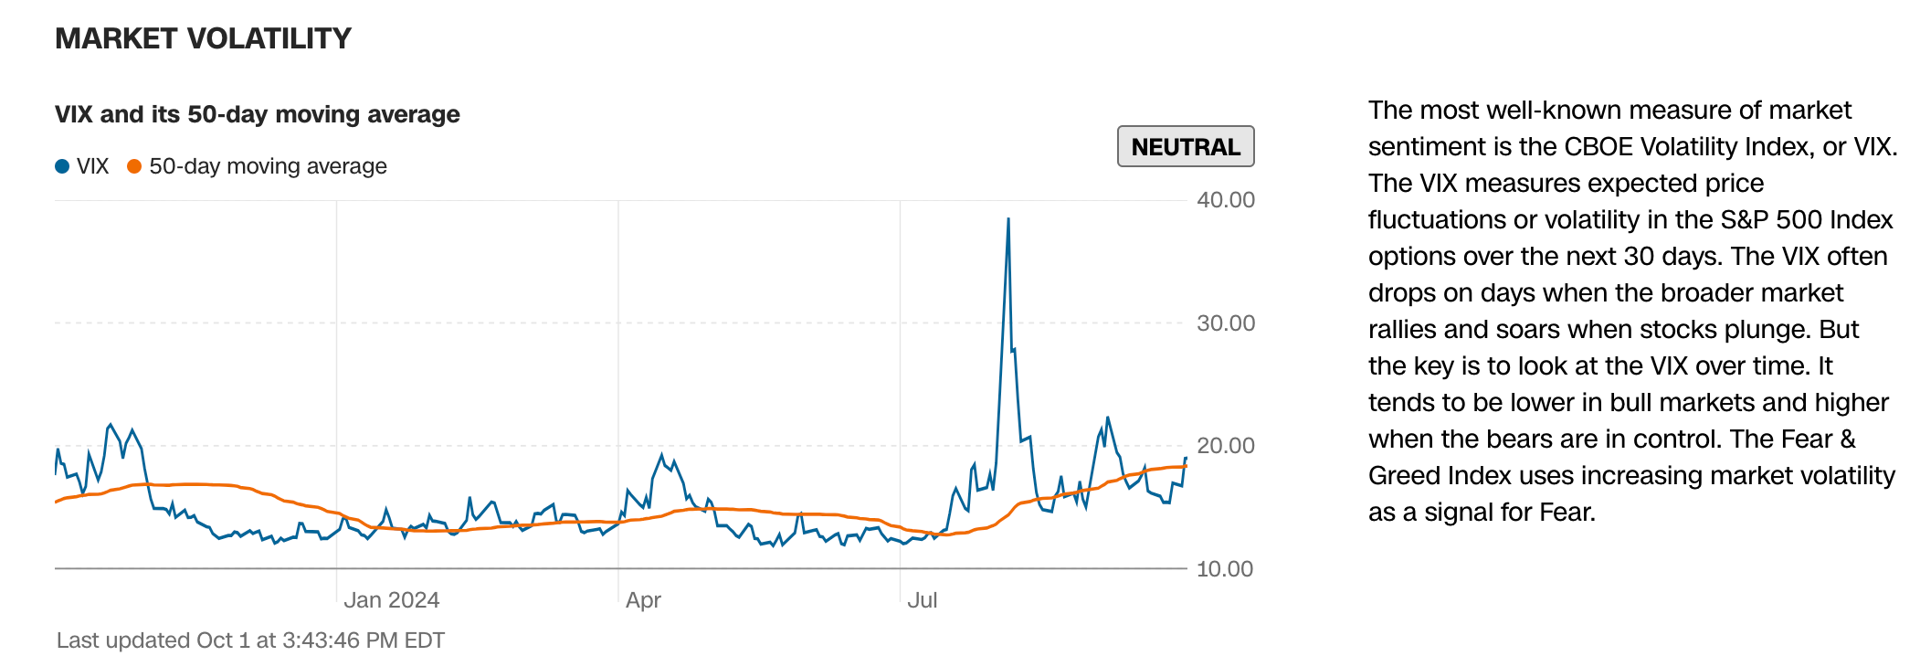
The options portions of the indicator give some pause, however. The VIX is neutral because it’s only included in the indicator when it spikes 1.5 standard deviations above its 50-day average. But that doesn’t mean we can’t analyze it! What stands out is that series of rising lows. Somebody is getting worried and they’re hedging their portfolios.
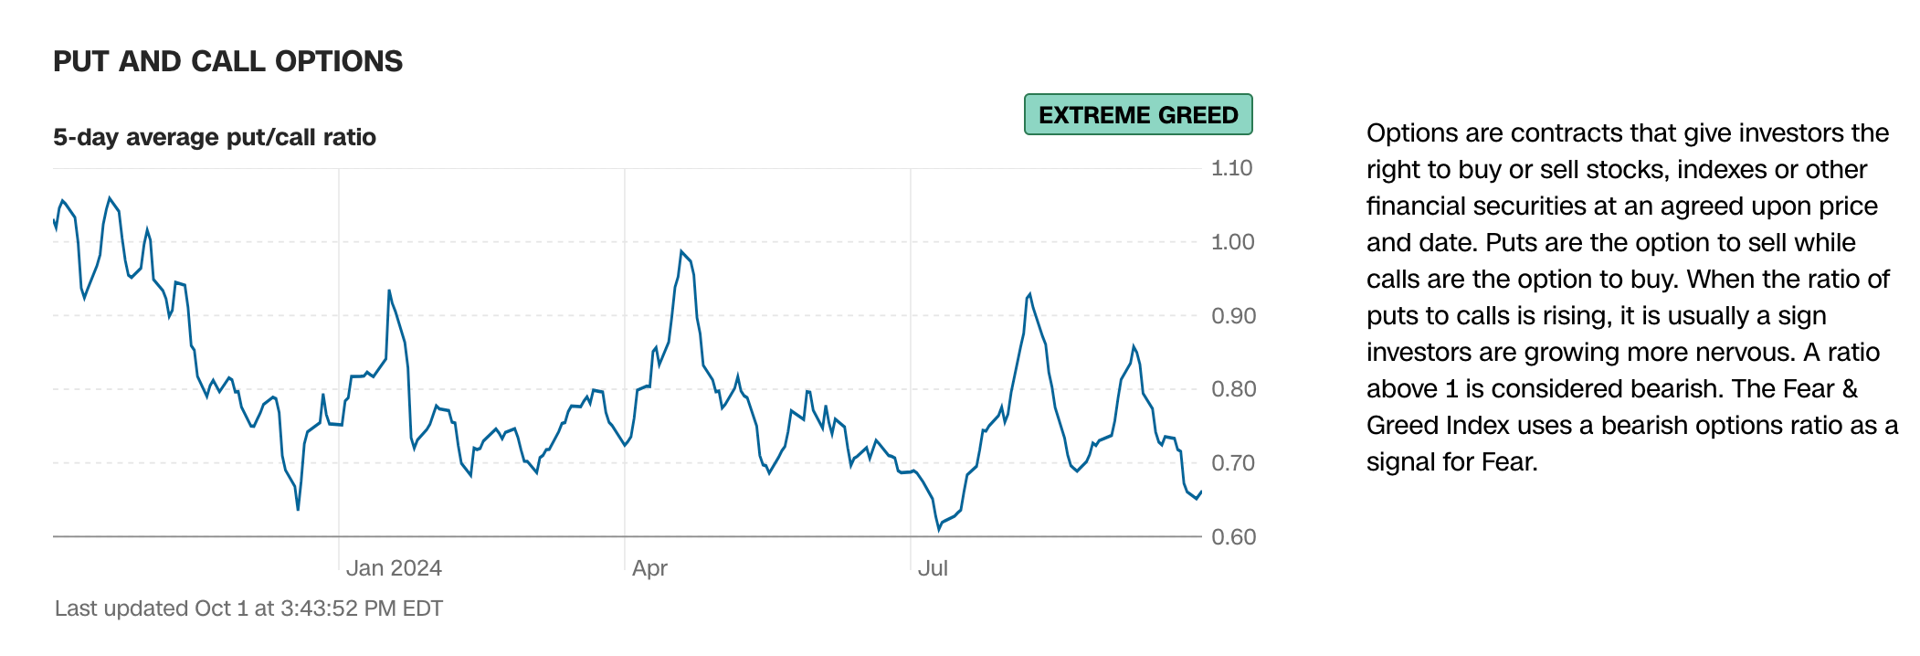
You know who’s not hedging? Call buyers. The 5-day average Put/Call ratio shows a high level of bullish speculation.
Bonds aren’t worth mentioning right now. The indicators contradict one another and, somewhat, cancel each other out. That's fine, because neither indicator is really at any sort of extreme or showing any trend.
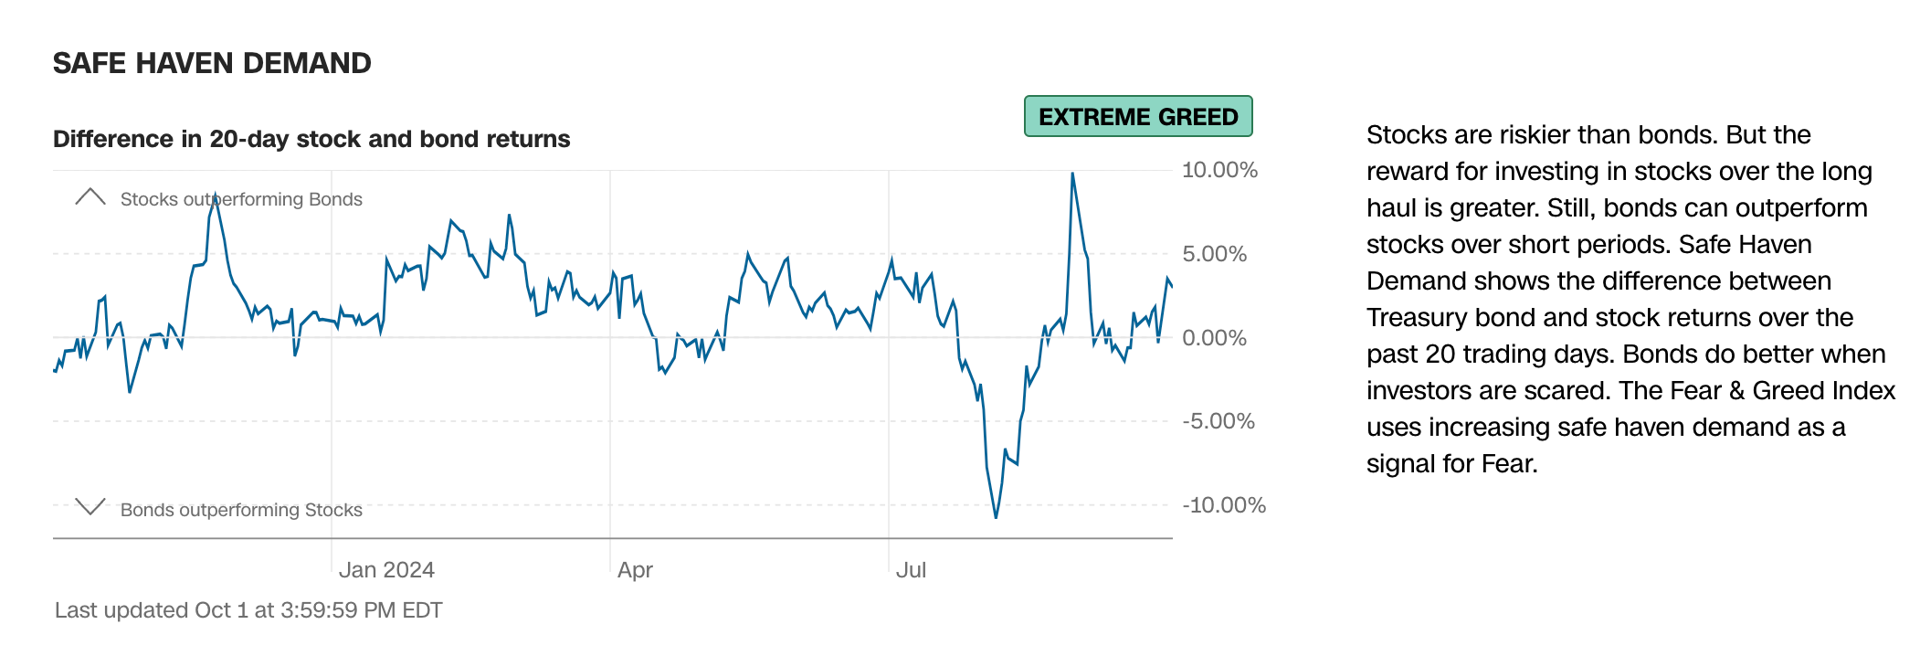
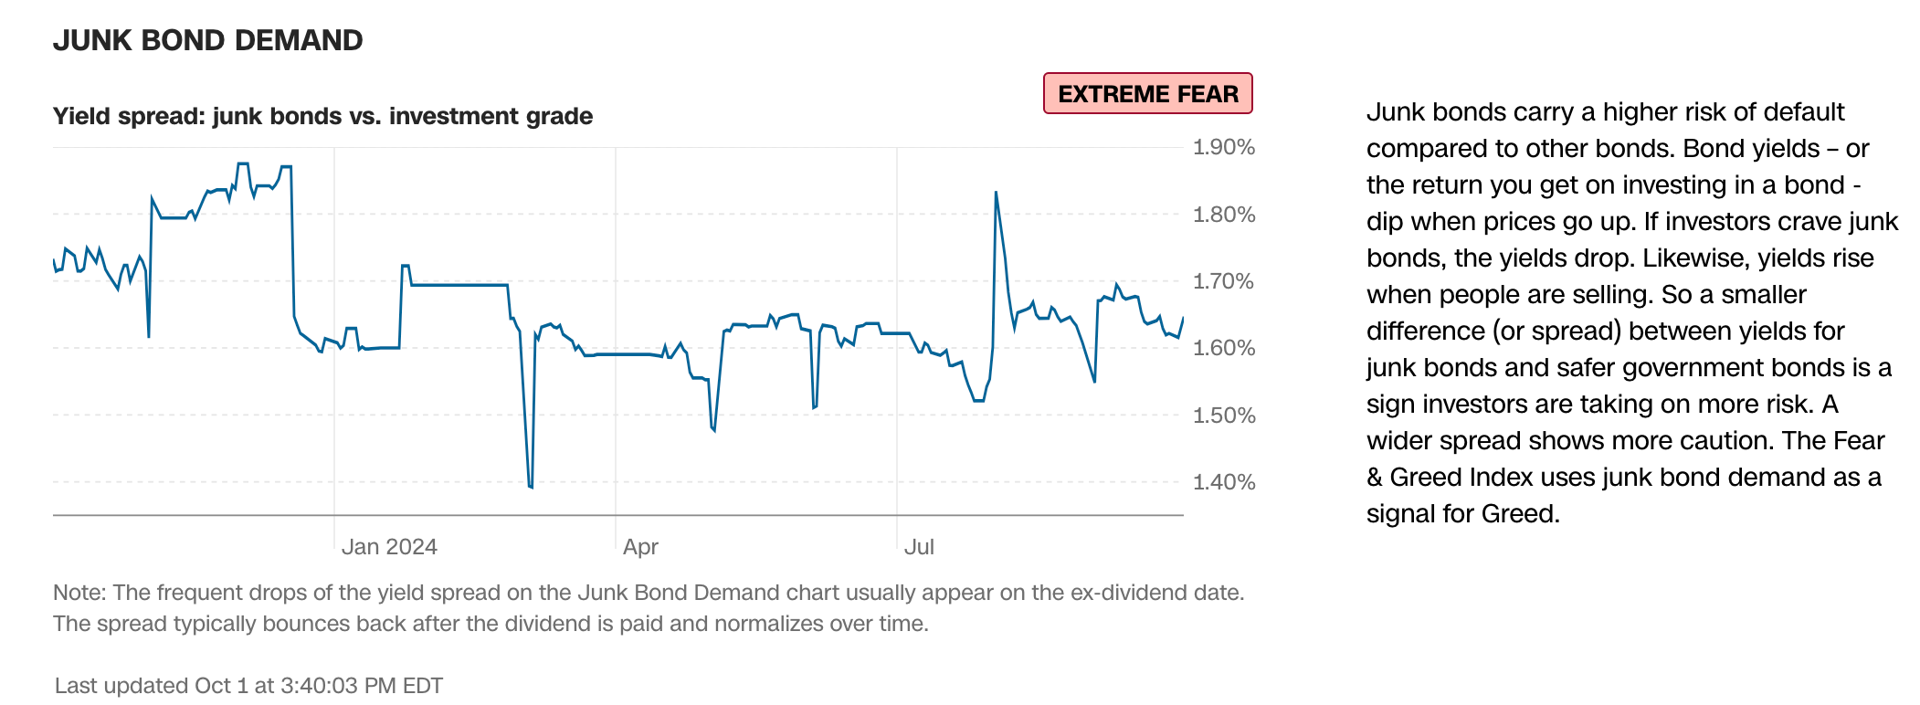
So, basically, stocks are good. Options are bad. Am I worried? September is usually the cruelest month. And, while it started off in the red, here we are on October 1st at all-time highs.
Markets climb a wall of worry and there’s plenty to worry about right now. But Fear & Greed doesn’t seem to be forecasting anything worse than a dip.