Charting the Markets: The S&P Is Still Bullish. But for How Long?
Stocks headed south in a hurry after inflation reports turned up hot.
You've reached your free article limit
You've read 0 of 1 free Pro articles.
The first week of earnings season has ended, and we have nothing really positive to mention. The banks kicked things off early in the week and sold off following their reports as usually happens. But later in the week the markets became spooked following some hot inflation data, especially on the producer price index. That number was super hot — annualized the headline number is at 15%. That is pretty extreme but should not be unexpected with higher energy, gas and food prices among other things. While some try to spin that differently, make no mistake — the consumer is feeling the pinch.
The markets were down more than 1% on two of the last three days of the week, finally seeing some volatility. Former leaders like semiconductors were nowhere to be found, volume trends have now turned bearish on the market as several groups/sectors have gone MIA.
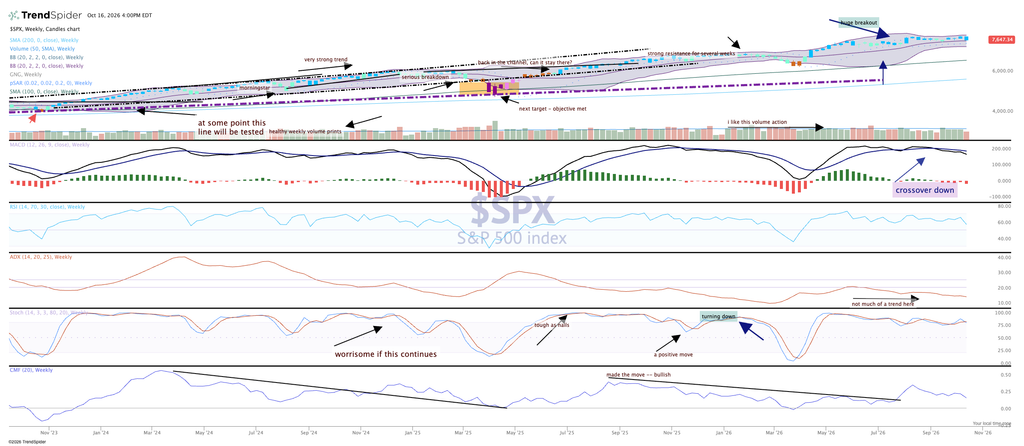
The weekly chart of the S&P 500 is still bullish; that is astonishing. We’ll give the benefit of the doubt to the bulls, but barely. The moving average convergence divergence remains on a sell signal and once again the Stochastics have turned lower. Money flow, as seen at the bottom of the chart, is also lower too, but still positive. It may take some time to turn back up. As for the price action, another down week or two will change the rating to cautious at least. Volume trends are turning bearish, right before the heavy earnings are released (tech, industrials).
At the time of publication, Lang had no position in any security mentioned.