Carrie Is Still Winning, But Don't Ignore What Lies Beneath
There is weakness under the hood and one particular uptrend line is in jeopardy. Breaking a line in place for nearly five months would be something to fuss over.
You've reached your free article limit
You've read 0 of 1 free Pro articles.
I began this week noting the bulls would liken this market to the movie Carrie where just when you think it’s rolling over the hand comes up from the grave and it’s still not over. The bears were hoping we’d beware of the Ides of March. The S&P 500 sat then at 5123 and now it sits at 5150. For now, Carrie is still winning.
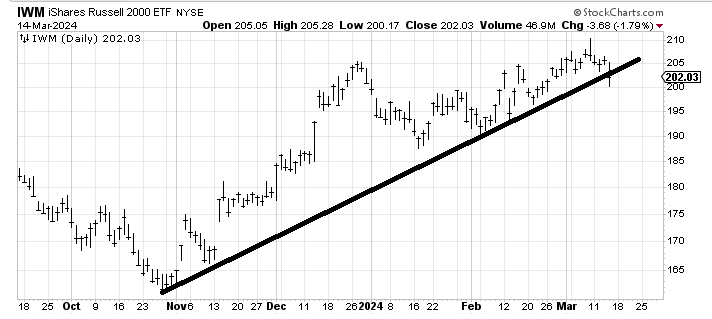
That means the uptrend lines are still intact. One uptrend line in particular is in jeopardy, though. But don’t worry, it is not the beloved QQQs or S&P, it is that of the iShares Russell 2000 ETF IWM. I have drawn in this line before, notably back in mid-February when the ETF was tagging this line dating back to the October low. You might recall at the time I said it was roughly the equivalent of the 50-day moving average and we cared about the direction of the moving average.
Fifty trading days ago was the first day of the year. That means if this line breaks the moving average line is likely to flatten out at first because we’d be replacing today’s readings with those readings in early January (i.e. the same approximate numbers). But breaking an uptrend line that has been in place for nearly five months is something to fuss over.
There is weakness under the hood, as we have discussed. It is evident in the Overbought/Oversold Oscillator. How is it the market indexes are at the highs and this couldn’t even challenge the late December reading and is now well below the zero line? It only gets that way with weakness underneath.

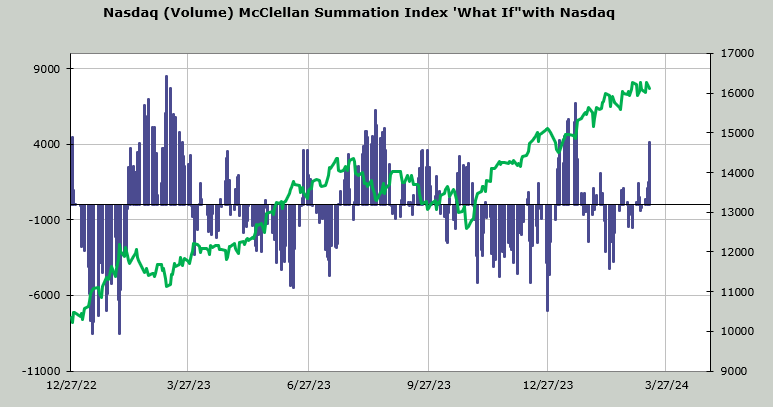
Another version of this is the "what if" for the Nasdaq McClellan Summation Index. Here I use volume instead of the advance/decline line. It now needs a net differential (up minus down volume) of +4.2 billion shares to halt the decline of the indicator. If that seems like a lot it is because it is. The Nasdaq typically trades around 5 billion shares a day. So it would need at least two days or one major lopsided up day to change it.
What you should notice is this doesn’t typically occur at highs, but typically occurs after the indexes have declined. That’s because readings like this are extreme; readings like this show there has been an awful lot of selling underneath.
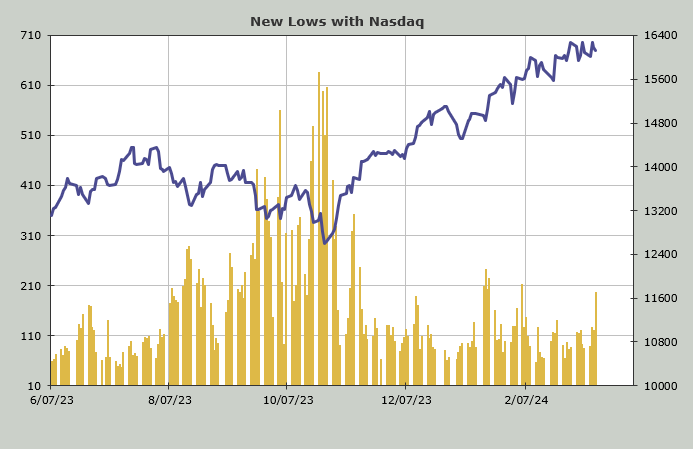
The same is true for the number of stocks making new lows. The Nasdaq had nearly 200 new lows on Thursday, rivaling the readings from six weeks ago. So yes, there is selling under all that goodness in the major indexes. But you probably didn’t need me to tell you that. After all, the beloved semis are down 8% in a week.
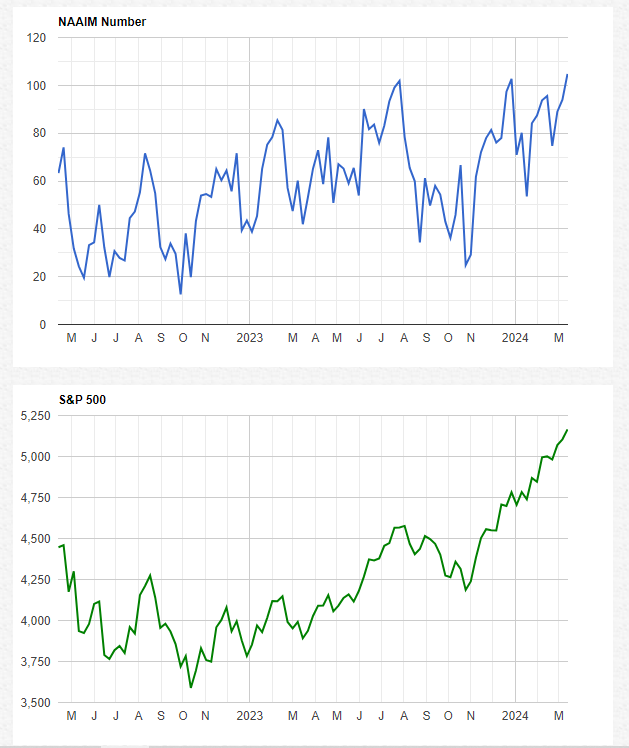
Finally there is sentiment. Wednesday we looked at the Investors Intelligence survey where there are more than four bulls for every bear. Now we have the National Association of Active Investment Managers (NAAIM) where they have lifted their exposure up to 104.75. That is the same area as we saw last July and again at year-end, just before that swoon in the first week of 2024.