Wall Street Bears Become an Endangered Species
There's now more than four bulls for every bear. Yeah, that's extreme. Here's what it all could mean for the market.
You've reached your free article limit
You've read 0 of 1 free Pro articles.
Earlier this week I showed the chart of the Citigroup Panic/Euphoria Index. It has been bumping up against "Euphoria" but has not yet crossed into it. It might do so when I see the chart again this coming weekend. I thought of this since I was asked if I think there is actual euphoria in the market.
I cannot call the entire market euphoric. I can say the semis and AI are euphoric. I do believe there is a high level of complacency in the market, though.
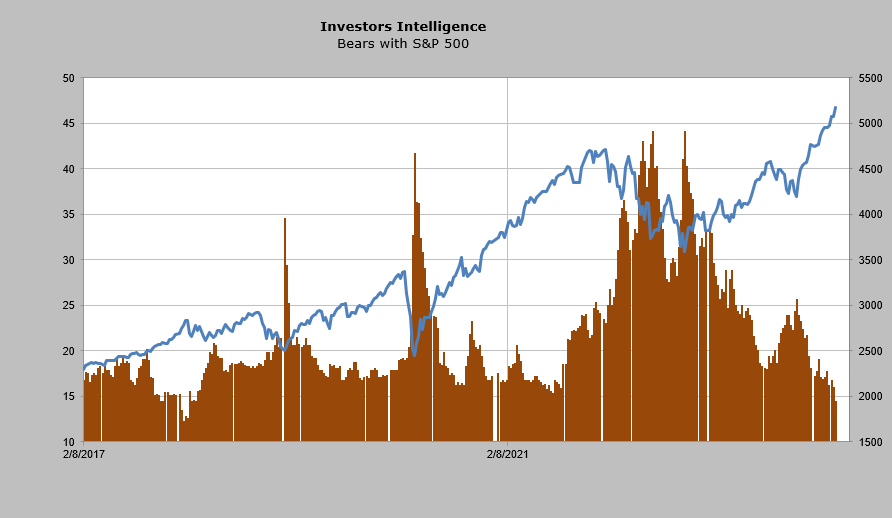
This week’s Investors Intelligence readings finally saw the bulls top 60% as they chimed in at 60.9%. This is the highest reading since 2021. But bulls have been drifting higher for weeks now. It was the move in the bears that captured my attention. They slipped under 15% to 14.5%. Now that does not happen very often.
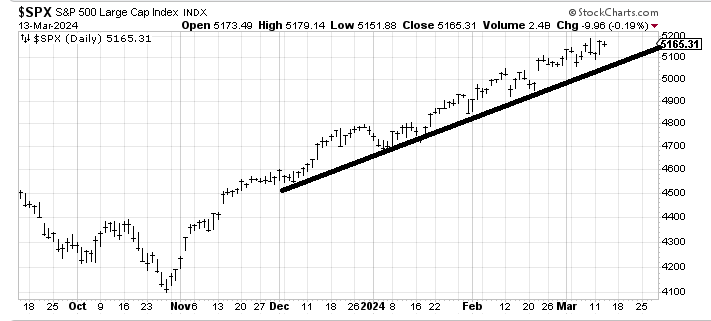
The last time the bears were this low was January 2018. Some of you might remember that was just prior to Volmagedden, when the VIX surged, stocks fell and the VIX ETFs imploded. You can see in the chart below how the S&P 500 fell 10% in a matter of days back then. But also note that stairstep move upward and the line I have drawn.
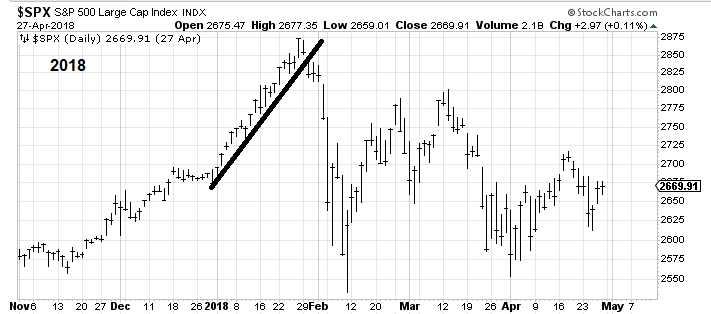
Over on the left side of the chart, below, of the bears with the S&P 500 you can see where the bears sunk just prior to the S&P’s correction.
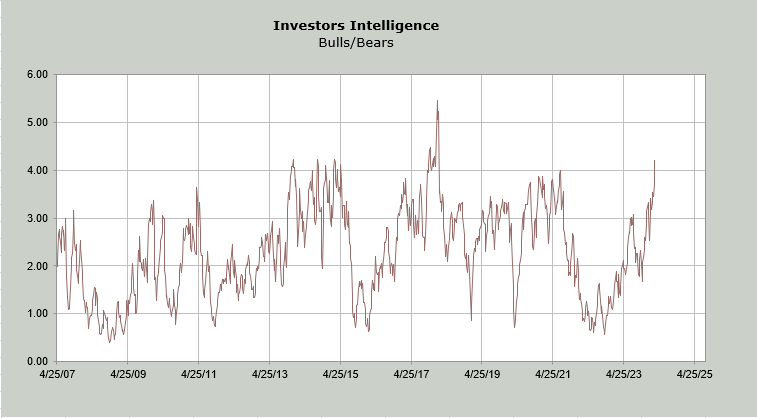
Then I did some math and I discovered that there are 4.2 bulls for every bear. Is that a lot? Yes! At that January 2018 high we had just over five to one but mostly once we get over four it’s gotten pretty extreme.
Look back at that S&P chart from 2018 again. Notice that even after we broke that uptrend line there were three days that we milled around – giving traders a chance to sell — before we cracked. It doesn’t always happen that textbook-like but you have to admit there is some validity to my view that unless/until this line breaks we haven’t changed the pattern and the pattern needs to change for a proper correction to take place.
As for Wednesday’s trading, once again we saw the Either/Or market in effect. Big or mega-cap tech took a breather and everything else was allowed to rally, or at least try and rally.
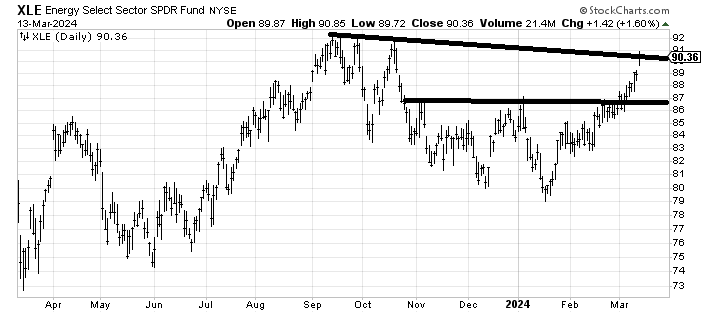
I do want to revisit the chart of the Energy Select Sector SPDR Fund XLE. Back in January when oil and energy stocks were down and out I turned positive on the group. It’s been a rather quiet move up for them. After all what is a 10% move up when you have Nvidia NVDA doing that in a day or two? But slow and steady has paid off in energy.
XLE is now at some resistance. I would expect a back off and another rally. What surprises me is that no one seems to be fussing — yet— over the move in energy.