A Market Hanging by a Thread
The S&P, banks, and semiconductors are all clinging to critical support while oversold conditions deepen. One decisive break could finally trigger the sentiment reset that bulls have so far avoided.
You've reached your free article limit
You've read 0 of 1 free Pro articles.

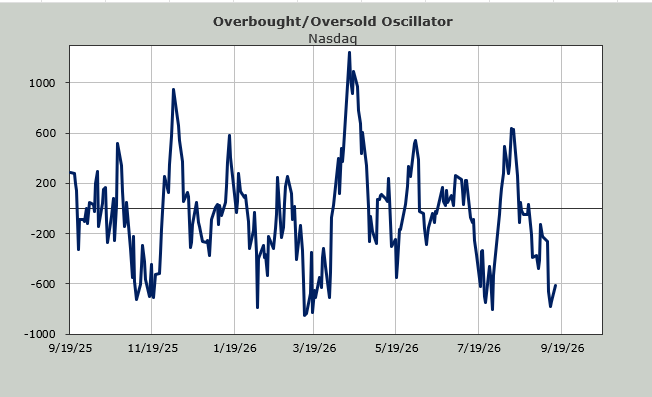
The market is oversold. You don’t need me to tell you that. Everywhere you turn, there are folks showing all sorts of charts displaying the oversoldness. It’s all short-term oversold conditions, but intermediate-term ones are finally getting to the point where we can see them shaping up.
For most of the last few years, as soon as the market got oversold or even sniffed at an oversold condition, it rallied, and it rallied hard. Often, it did not bother to wait for us to fully line up to a good oversold condition. That is a change this time around.
In the first place, the Oscillator has plunged with very little price action. That’s a change. Since the spring low, the oversold condition arrived around -200 on the Overbought/Oversold Oscillator. And you can see, the S&P had a commensurate pullback most of those times. But this time the Oscillator has plunged without price.
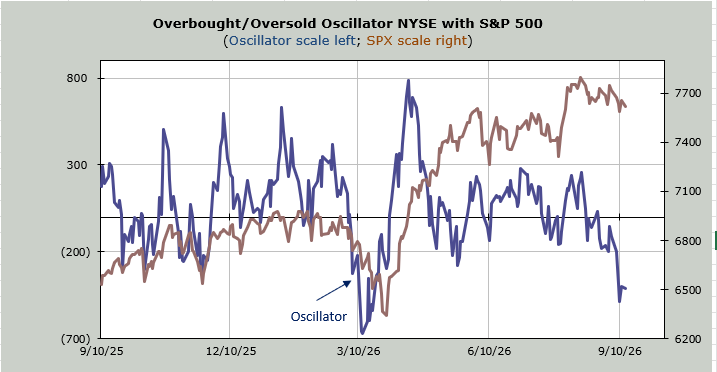
But also notice how once the market got oversold, the S&P surged upward. Not this time. This time, it is doing an awful lot of churning, not surging.
We’ve looked at the Hi-Lo Indicator several times of late. Today it sits at .23. It gets oversold under .15. Here too, notice that the last two readings did not bother to get all the way to the teenage level but stopped short before rallying. Now we have very little movement in the index, yet the indicator is pushing rapidly toward an oversold condition.
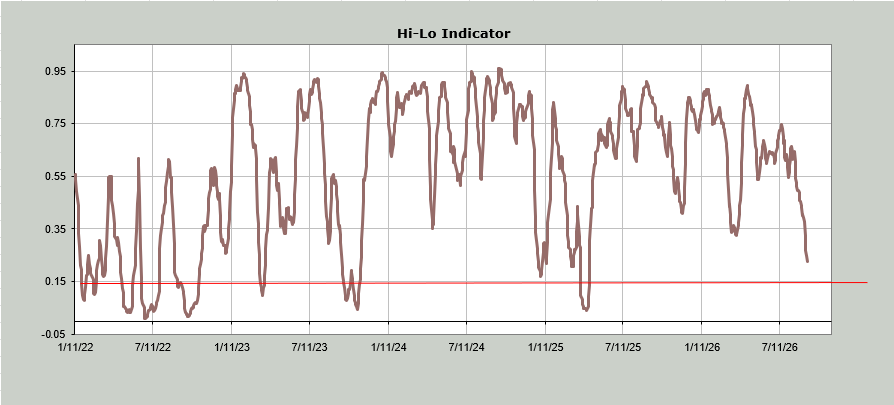
I think it is because the sentiment is so stubbornly complacent. As I have said before, oversold conditions with bearishness lends itself to a good rally. We just can’t seem to rock the complacency. Not yet.
But now let’s move on to the 30-day moving average of the advance/decline line. I call this the intermediate-term Overbought/Oversold Oscillator. It got oversold at the spring low and then overbought in mid-May. Since that overbought reading, the S&P has been milling around for the most part. You can see (blue line) the loss of momentum in the indicator.
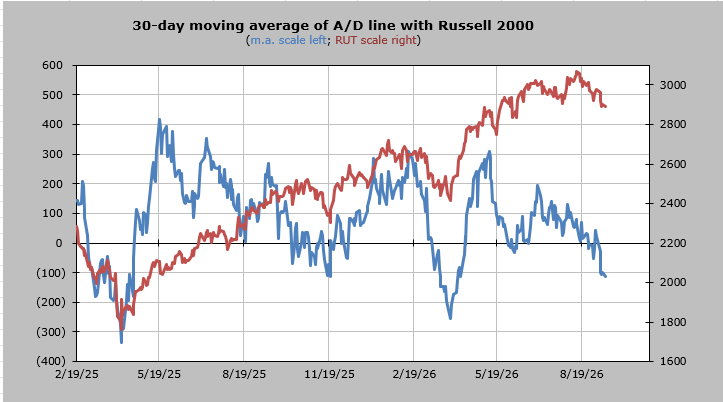
What I do here is look for a point in time when there will be a long string of red breadth numbers to drop. That’s when I call this oversold. My estimation is that will occur in about two to three weeks.
Should we manage to rip the complacency bandage off before then, I would not argue too loudly that we are set up for a good rally.
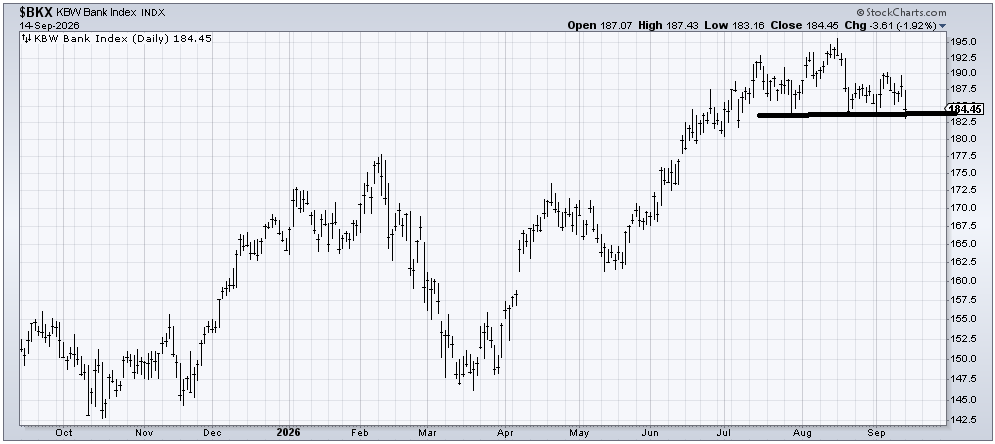
In the meantime, the market did very little to change my view of this chop-fest on Monday. I would, however, highlight that the Bank Index sits at a very important line. I have been cautious on the banks since July, and all they have done is chop about. Maybe if we can break that flat line, we’ll get some hysteria?
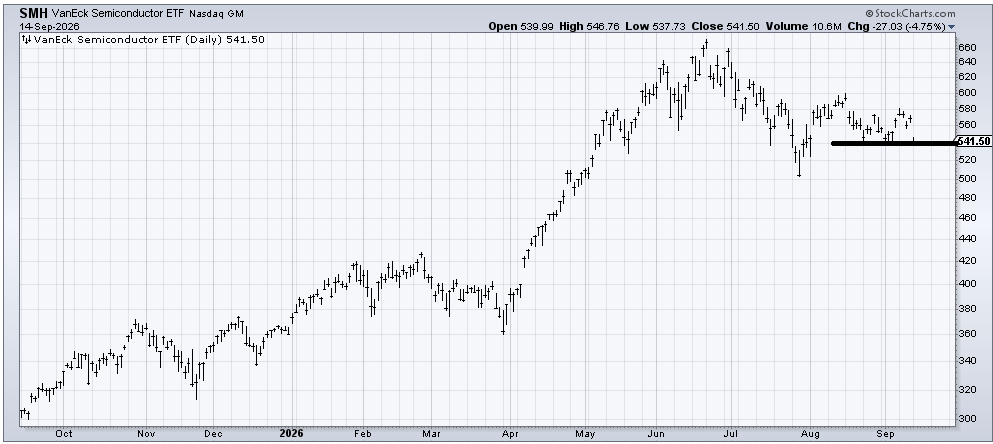
And it’s not just the banks or the S&P which clings to 7600. Look at SMH, an ETF to be long the semiconductors. All that selling in the semis on Monday, and still that 540 area hangs on. Someone should just push all of these charts over so that we can get a change in sentiment.