What’s Driving This Market? Complacency.
Something has got to change and I think it will happen sooner rather than later.
You've reached your free article limit
You've read 0 of 1 free Pro articles.

The Market
I would like to tell you there was a level of concern today, but if there was, it was fleeting. The SOX, for all the bad news, still hasn’t broken. It is, however, on the verge of doing so, but that 11,000 area (or 540-ish on the SMH) is hanging by a thread.
All we had was an Either/Or Market. Either the semis pull back, and there is room for other stuff to rally, or the semis rally, and there is nothing left for the others.
Oil was higher and gave much of it back. I will reiterate that I think oil stocks have stretched about as far as they should for now. Perhaps at some point I will like them again, but now is not it.
Bonds got to 5% and backed off. Not by much, but back off they did. I still think with the DSI getting to 9 last week, bonds could have one more fling (another fling higher on rates) that might finally shake up the complacency on stocks) but I think rates are getting long in the tooth as well.
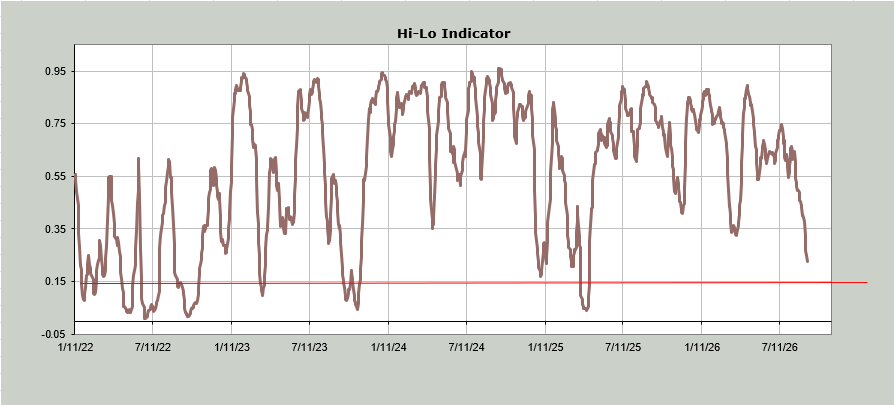
The Hi-Lo Indicator for the NYSE is now at .23, and Nasdaq is at .24. Just because they get oversold (under .15 for the NYSE and under .19 for Nasdaq) doesn’t mean we have an all clear, but it is when the risk/reward gets much better.
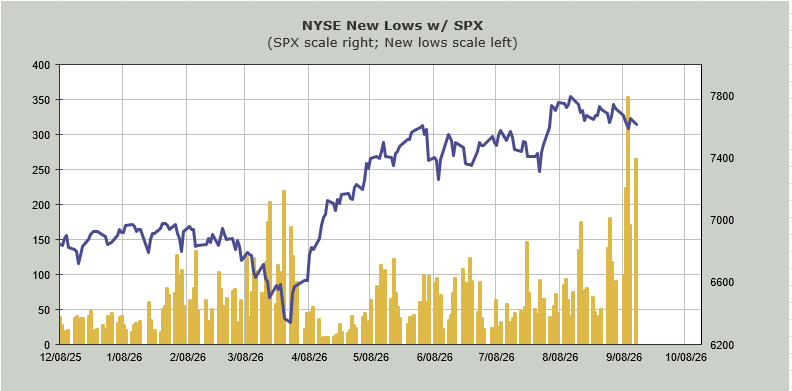
None of the indexes made a lower low, but the number of stocks making new lows did not expand today. That is the first down day we have seen that.
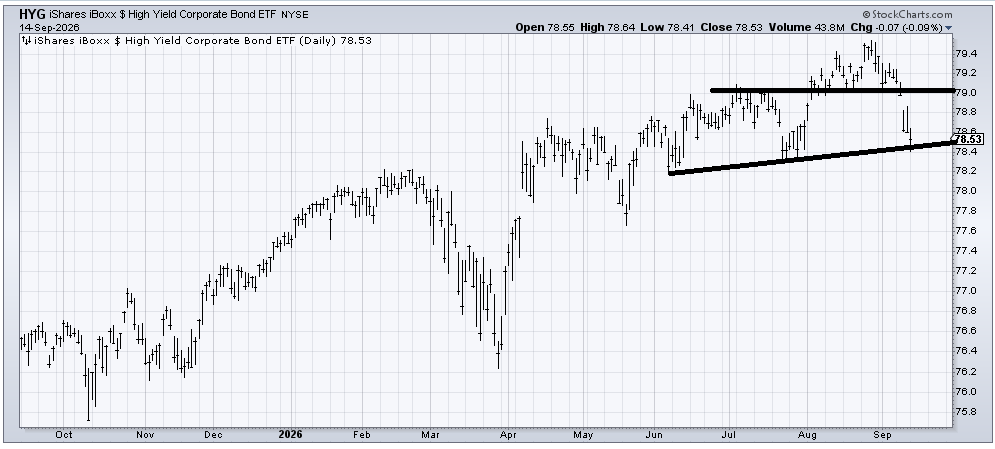
I also want to follow up on HYG, which we looked at last week. It has now broken 79 and has found some support down here, but for all the folks saying credit is holding up, I would say credit is not holding up as it was a few weeks ago.
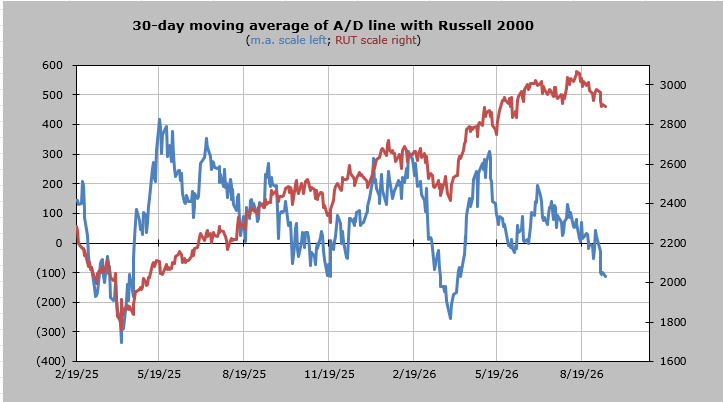
Down below, you will see the 30-day moving average of the advance/decline line. It looks oversold, but my math says it is likely to take another couple of weeks to get it to a fully oversold condition, but at least I can see an oversold condition setting up for the first time since last spring.
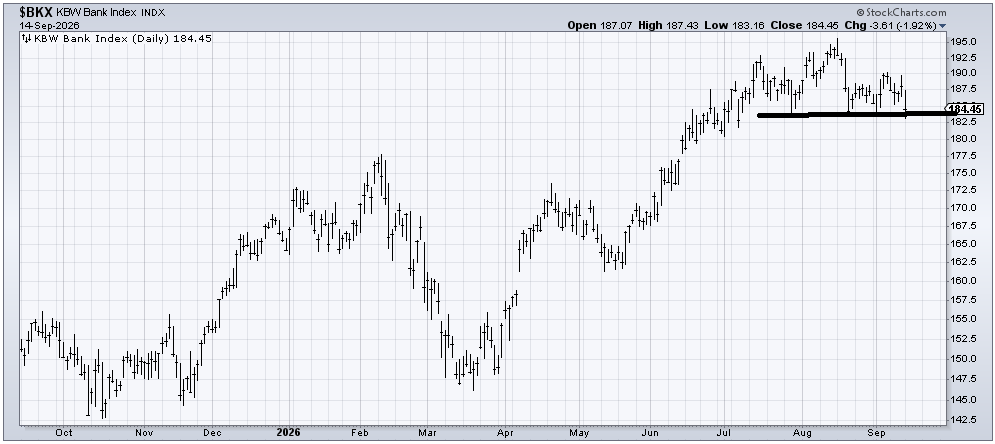
Finally, there are the banks. I have been negative on the banks since July, and they have mostly gone nowhere in that time. I continue to think Citigroup (C) acts the best of the bunch. Bank of America (which I have been bearish on) had quite a tumble today, but the Bank Index itself has not yet broken. Let’s watch this 183 area because maybe, just maybe, that might bring about some bearishness.
That’s what I desperately want: the complacency to change.
New Ideas
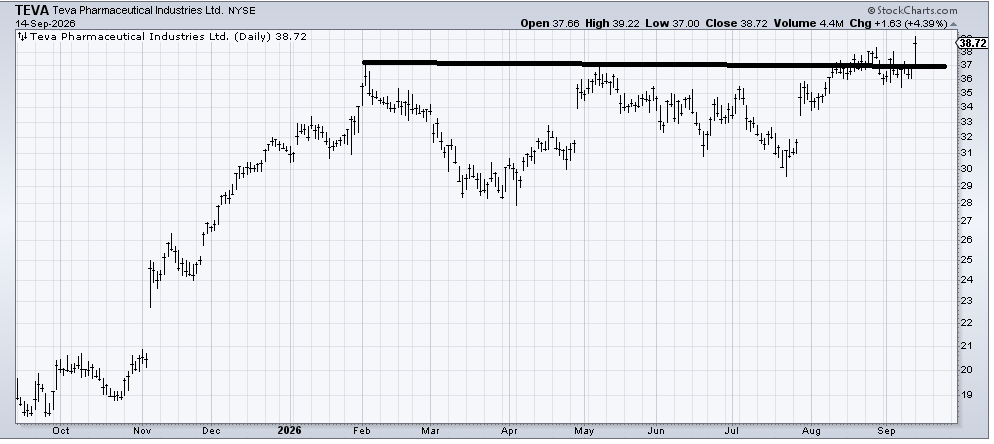
Teva (TEVA) finally broke out today. I’ll be honest, I’m not sure I trust it, but as long as it stays over 37, it has to get the benefit of the doubt.
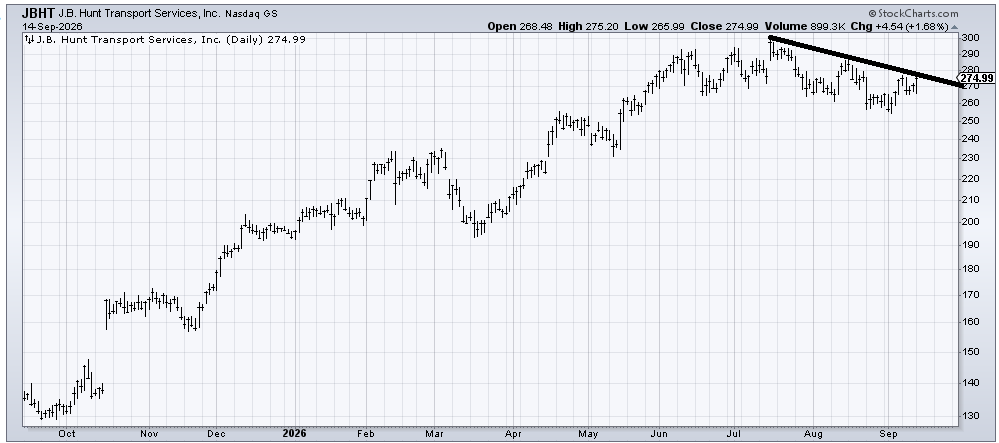
I was wrong on JB Hunt (JBHT). I thought it would break down, and instead it has saved itself and rallied. If it crosses that downtrend line, it will be impressive.
Today’s Indicator
The 30-day moving average of the advance/decline line is discussed in full above.
Q&A/Reader’s Feedback
Helene welcomes your questions about Top Stocks and her charting strategy and techniques. Please send an email directly to Helene with your questions. However, please remember that TheStreet.com Top Stocks is not intended to provide personalized investment advice. Email Helene here.
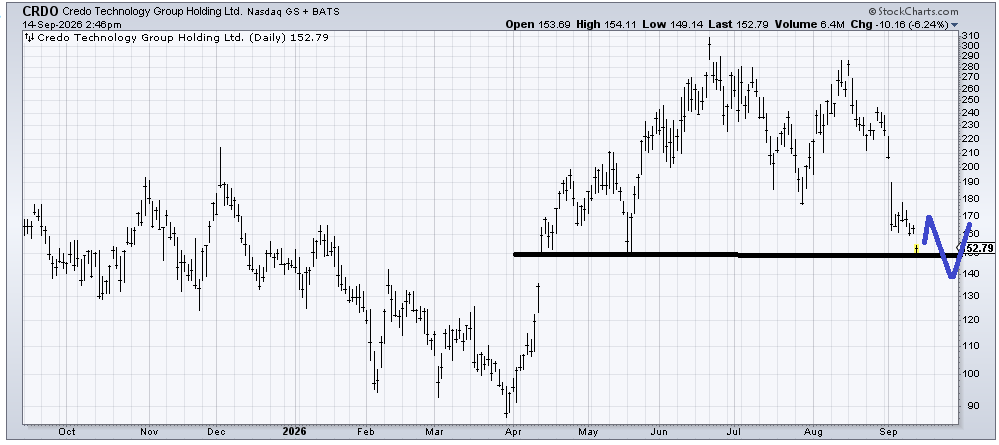
Credo Technology (CRDO) has some support here and is oversold. I would like it to fill that gap below (around 138), so if it bounces as I have drawn in blue and then comes down to fill the gap, perhaps the setup is better (i.e., we are oversold AND sentiment is bearish). Overall, the chart is bearish, but I’m just looking for a point where we might get a rally worth playing for.
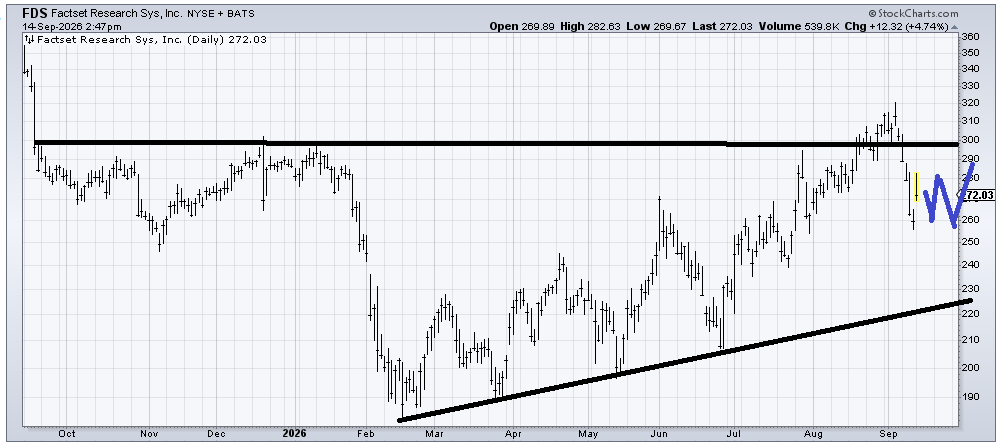
I really want to like the chart of Factset Research (FDS) but that give up from 320 is a bit sharp for my taste. If it can hold over this 255 area for a few weeks, perhaps it would look smoother and therefore more intriguing to me.
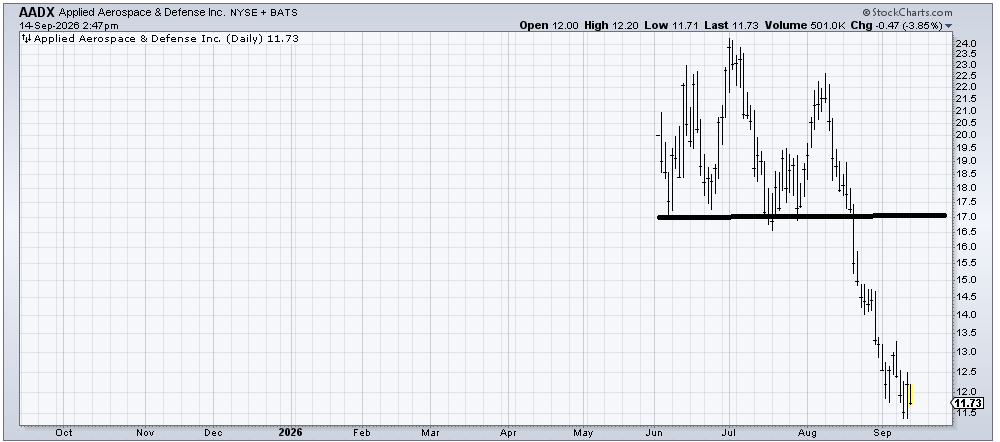
Applied Aerospace & Defense (AADX) is not a pretty chart. But it has a measured target in the 10-11 area, so I am inclined to think it tries to hold in that area. The chart is too short (time-wise) to make any firm conclusions, but if it can hold this 10-12 area, it gets much more interesting.
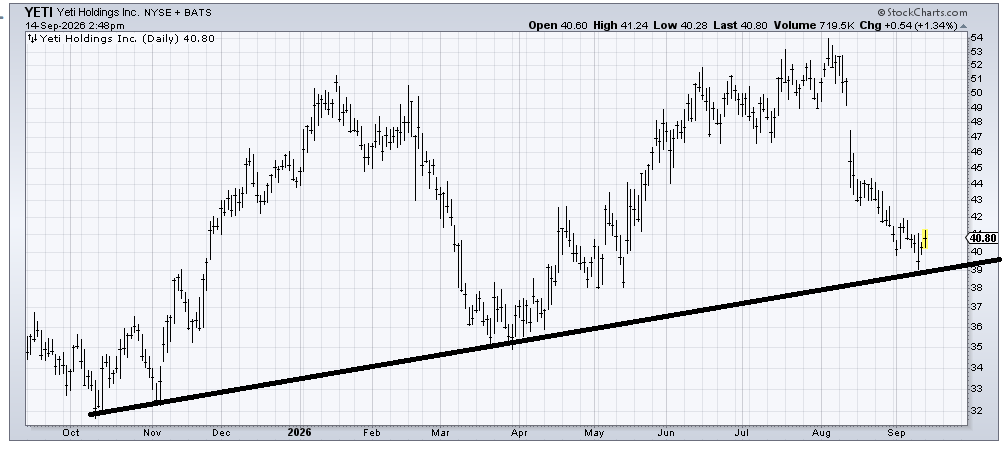
The risk/reward for Yeti (YETI) is pretty good here. Under 39 and you know you are wrong. And if you are correct, a rally toward resistance (light at 43, more serious at 47) is quite doable.
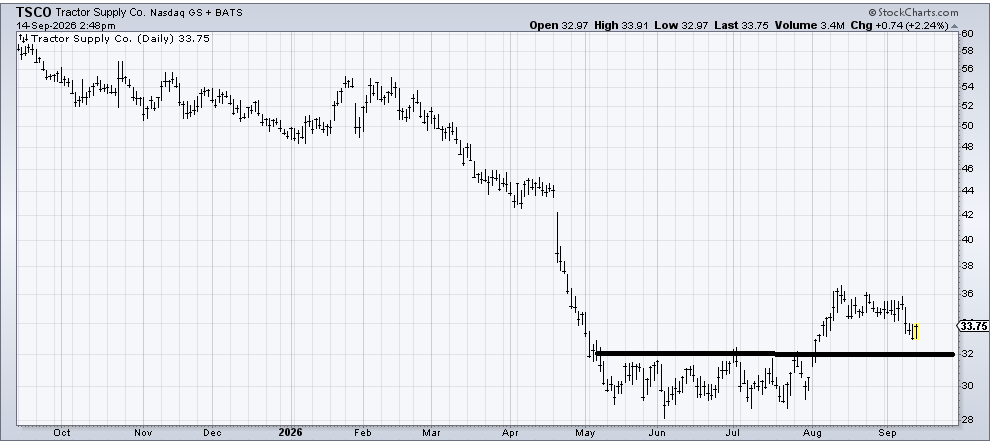
I am a sucker for charts like Tractor Supply (TSCO), except even I know I am early in liking it. A few weeks of milling around in the 32-34 area would probably be a nice set up for another push upward.
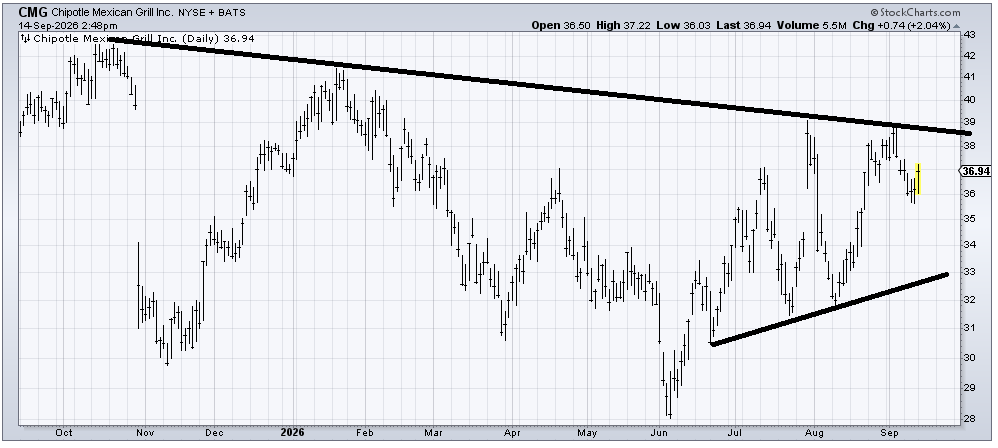
We looked at Chipotle Mexican Grill (CMG) a few weeks ago, and I wanted it to pull back from that line before it made a run at getting over it (39). Now it has pulled back. I would like to see it stay over 35 now.
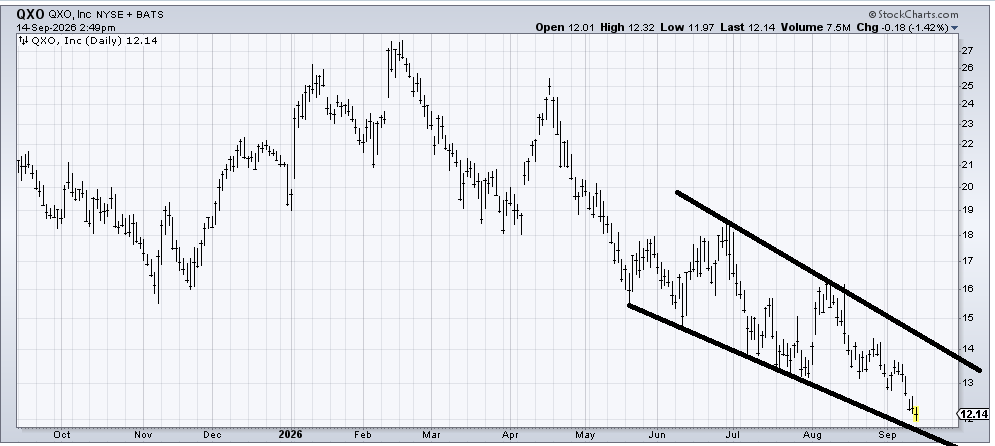
QXO (QXO) is a stock in a downtrend, so all we’d be looking for is a place where it can bounce from, and that would be the lower line, which right now comes in around 11. Two weeks from now, it would be closer to 10.50 and so on. There is a measured target in the 10-11 area, so if it tags that lower line, I’d look for a bounce.
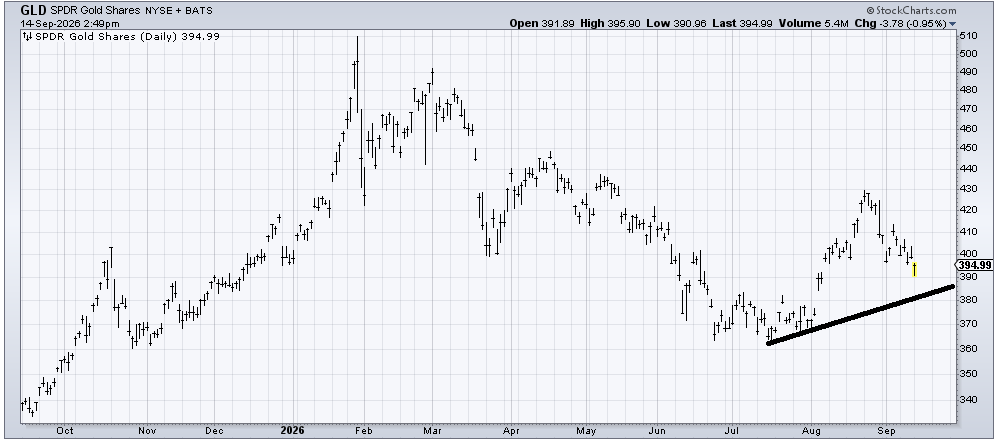
I wanted GLD (GLD) to stay over 395 to be okay, and it hasn’t. Technically, all it did was fill that gap at 390 today, but if it can’t get up and over 400 by the end of this week, then I think it heads down toward that 380 area.