Super Micro Computer's Stock Price Is Hard to Justify
The shares have risen four-fold in a short period of time from a relatively small base pattern. Truly amazing.
You've reached your free article limit
You've read 0 of 1 free Pro articles.
Super Micro Computer SMCI has soared sharply higher in the past three months, with one forecast calling for a $2,000 price target. However, shares of this manufacturer of servers and other computer products was cut to a fundamental "hold" recommendation by Aletheia Capital Monday with a $650 price target.
Let's check out the charts and indicators of this AI stock with the price of SMCI down about 4% in trading early Monday.
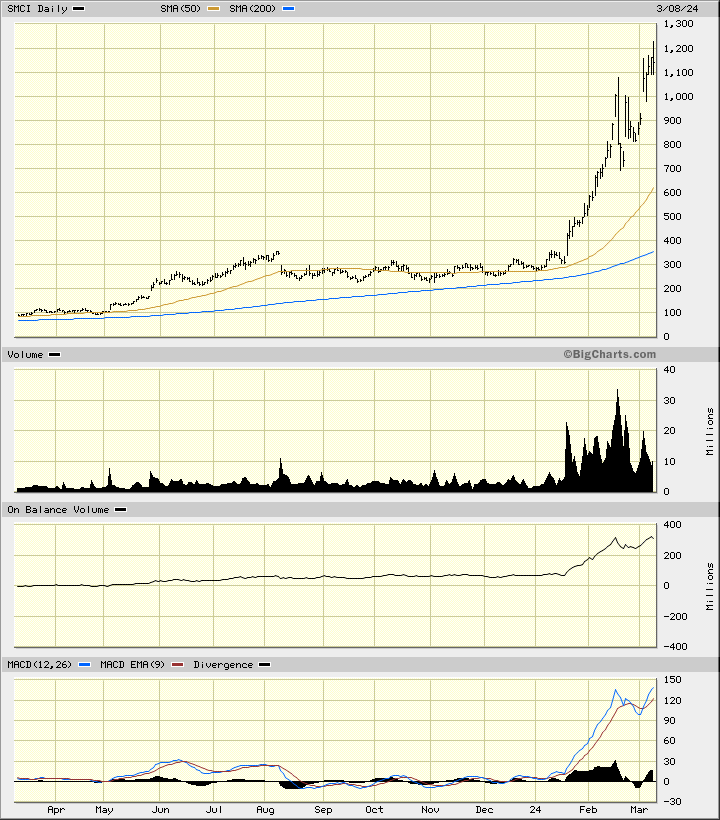
In the daily bar chart of SMCI, below, I can see that the shares traded sideways for about seven months before soaring upward in early 2024. The shares have risen four-fold in a short period of time from a relatively small base pattern. Truly amazing.
SMCI trades above the rising 50-day moving average line and the rising 200-day moving average line. Trading volume has been heavy since the middle of January but shows a dip in March so far. The daily On-Balance-Volume (OBV) line has improved the past year but has stalled since the middle of February.
The Moving Average Convergence (MACD) is above the zero line but starting to show a bearish divergence.
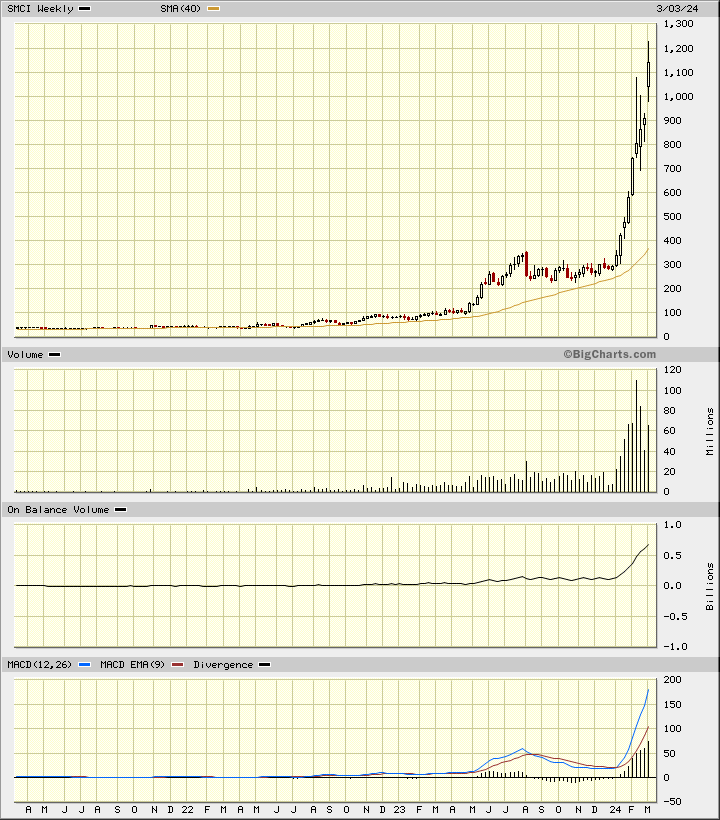
In the weekly Japanese candlestick chart of SMCI, below, I can see a huge rally from a small base pattern in the $100 area. The shares are extended above the rising 40-week moving average line.
The weekly OBV line and the MACD oscillator are pointed higher. The most recent candlestick pattern shows us an upper shadow telling me that traders have rejected the highs.
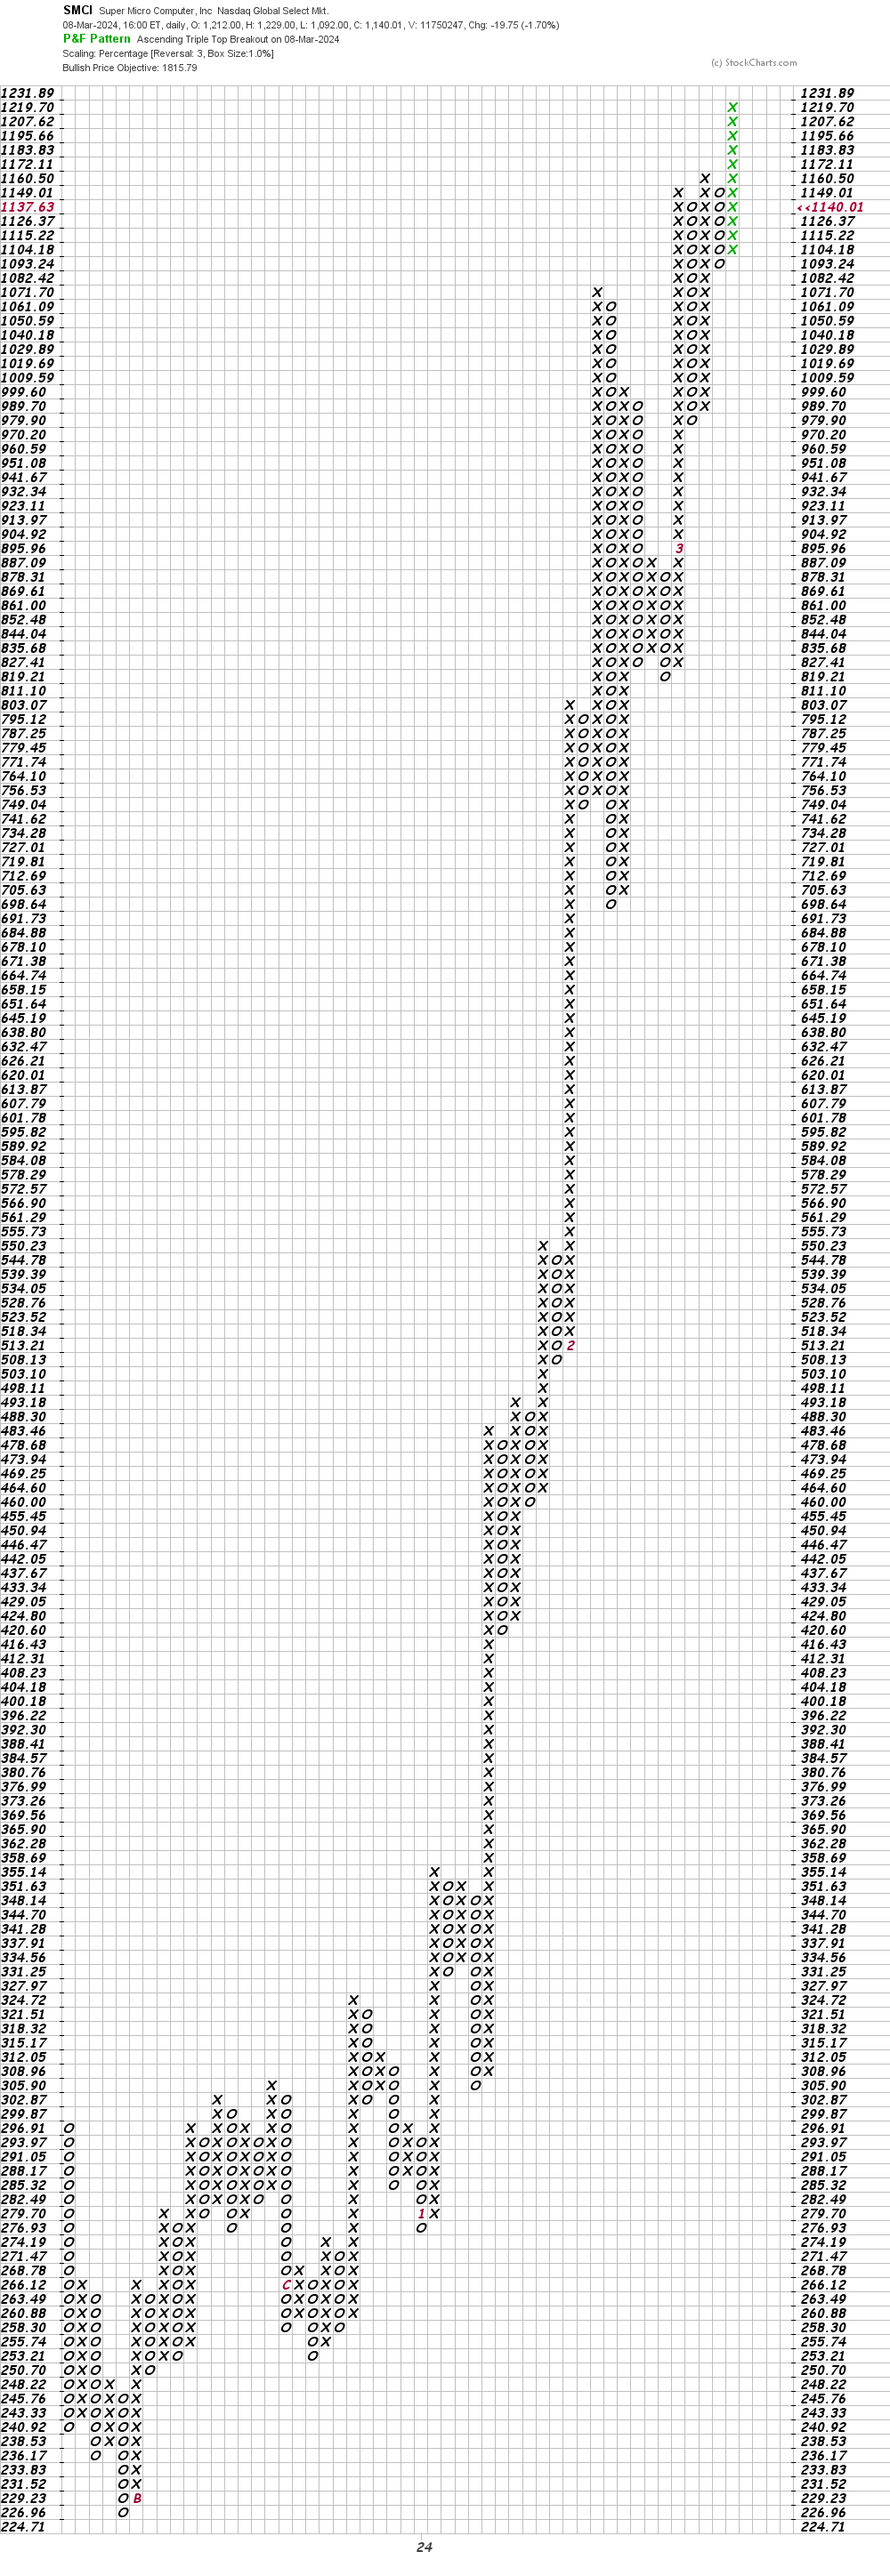
In this daily Point and Figure chart of SMCI, below, I can see a potential upside price target in the $1,816 area. A trade at $1,082 could start to weaken this chart.
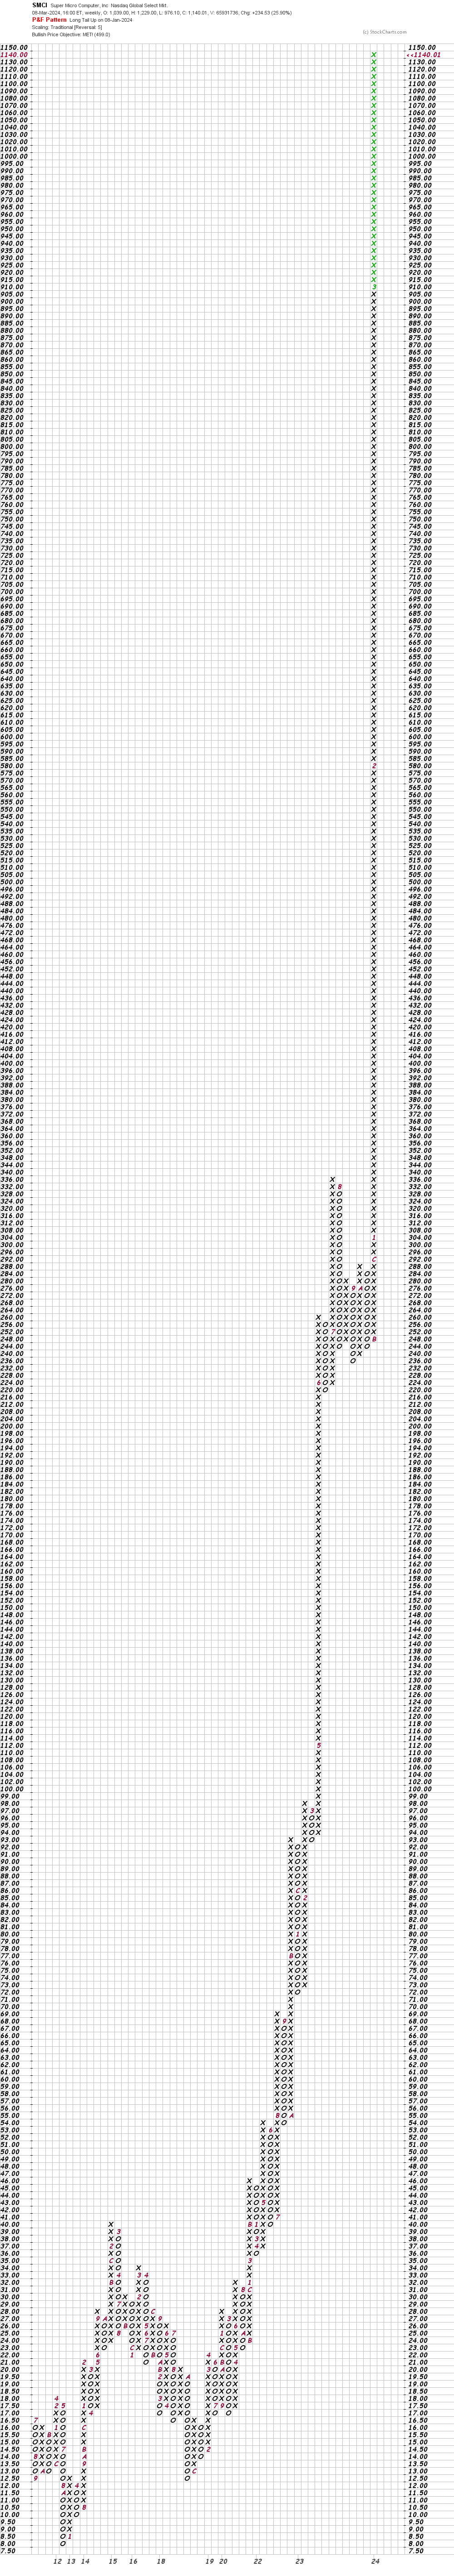
In this second Point and Figure chart of SMCI, below, I used weekly close-only price data with a five-box reversal filter, which could only produce a price target of $499.
Bottom-line strategy: The share price of SMCI is extended. It has soared to levels I cannot justify by technical analysis (maybe other technicians can do it, but not me). The charts have not made a top but prices can decline nevertheless. I would look for opportunities elsewhere.
Employees of TheStreet are prohibited from trading individual securities.