Will Monday Give Us the Reset We Need, or Is There a Bout of Volatility Coming?
Let's look at the indicators to see where we are with respect to bullish sentiment and breadth. And then, we'll examine GLD, BMY, WYNN, RH, and IGV.
You've reached your free article limit
You've read 0 of 1 free Pro articles.
The Market
At least folks did not seemingly get more bullish on the market on Friday. By that, I mean the DSI for the VIX stayed steady at 19.
But now, we’re back to the string of days thing. A long—it’s when it gets too long—string of up or down days needs to be broken. Too long, and we tend to get the rubber band stretched too far that it snaps when it goes the other way faster and further than you want it to. We’ve now had five straight green days, so a break from that string on Monday would ostensibly stop the string, shake the tree a bit, and should get that VIX DSI back up over 20.
That doesn’t mean it will reset everything, but it could. I still look for us to get back to a short-term overbought condition this coming week. And the intermediate term is already there (it has been there for months, which may be why we have made no progress since June).
If that VIX DSI gets to the mid or lower teens by the time we get short-term overbought then we are going to have to look for a bout of volatility into the end of the quarter. Could it be the Fed decision that stops the rally? Sure but I am not in the business of providing narratives. I just try and use the indicators and right now they say be careful chasing as we get into midweek.
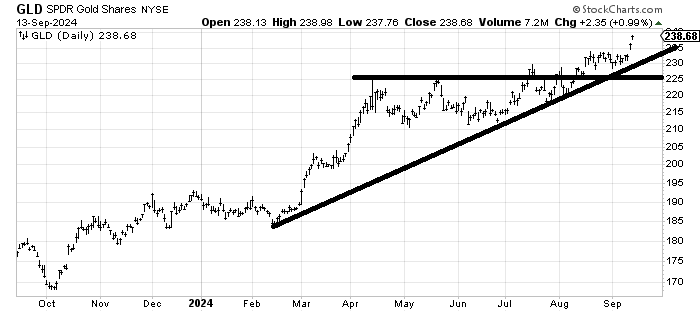
One other indicator I want to highlight is the DSI for both Gold and Silver is now at 85. They are waving yellow flags. It would be a red flag should either one get over 90. The chart of the SPDR Gold Shares GLD measures to 238-240, so I definitely would not be chasing and would consider taking something off the table, especially if it’s up again on Monday.
New Ideas
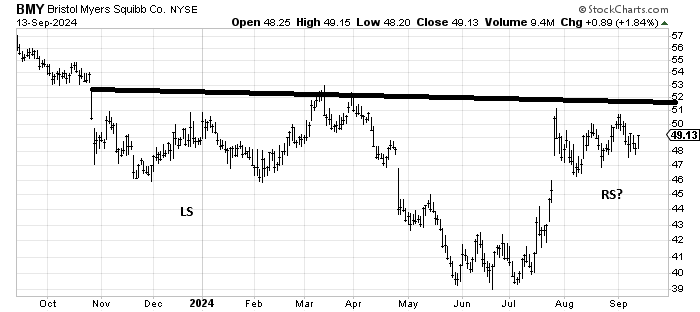
I was asked if I still like Bristol Myers BMY, and I do. I think it is forming a base. You can see how long it spent building that (potential) left shoulder, so the (potential) right shoulder is, by comparison, truncated at this point. I remain constructive on the chart.
Today’s Indicator
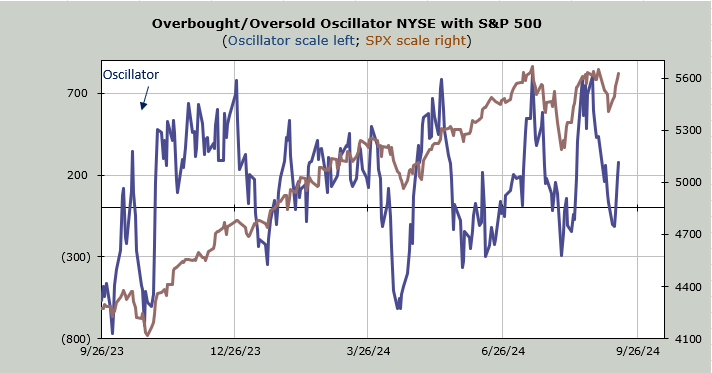
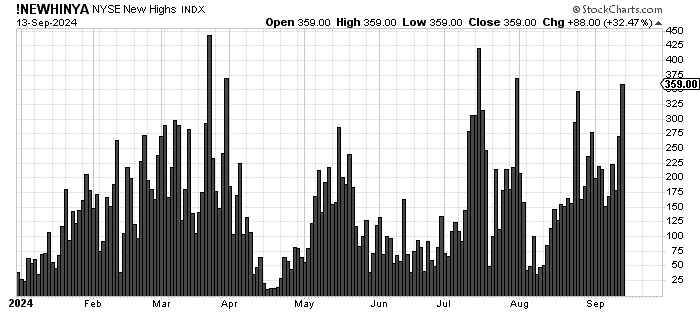
The new highs on the NYSE have been improving. There will be a negative divergence should the S&P make a new high and there are fewer than 450 stocks at new highs.
Q&A/Reader’s Feedback
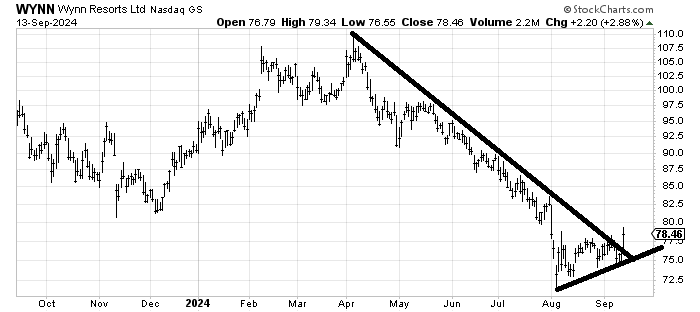
Now that I said something positive about Las Vegas Sands LVS a few weeks ago, I was asked if Wynn Resorts WYNN might also be improving. Yes. It crossed a downtrend line that has been in place since April, so unless it collapses back under 75, it should continue to improve from here. There is resistance in the 81-82 area, and I can get a very short-term measured target around 82, so that should be the first spot it runs into trouble.
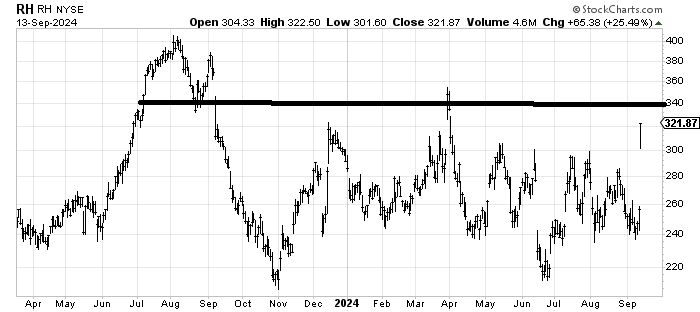
RH RH had a terrific pop on earnings Friday, but all it did was keep it in the range it has been in for nearly a year now. Notice, too, that RH has a tendency to gap up and down on earnings, and it has no follow-through. It gapped down in June, fell for another two weeks and then it came right back into the range. It gapped up in late March and fell right back into the range. I would guess it gets stopped at/near that resistance around 340-350.
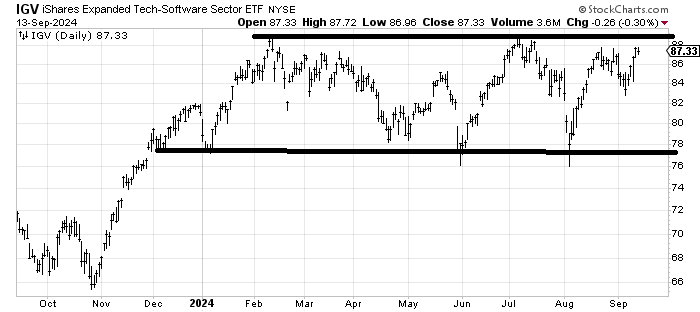
Can the iShares Expanded Tech-Software Sector ETF IGV, an ETF to be long software, break out of the range it has been in all year? I am impressed that it didn’t go down more on Friday considering Adobe’s earnings. I am inclined to think it can break out but it may not be imminent considering we’re running into a short-term overbought condition. The fact that it did not come close to the August low is a positive. I do not want to see it back under 83.