Will Krispy Kreme and Better Coffee Help McDonald's Weakening Charts?
Let's see what might move the needle.
You've reached your free article limit
You've read 0 of 1 free Pro articles.
The charts of fast food chain McDonald's Corp MCD have been weakening since late January. The company just announced that they plan to expand their partnership with Krispy Kreme DNUT across the U.S.
Let's check out the charts and indicators.
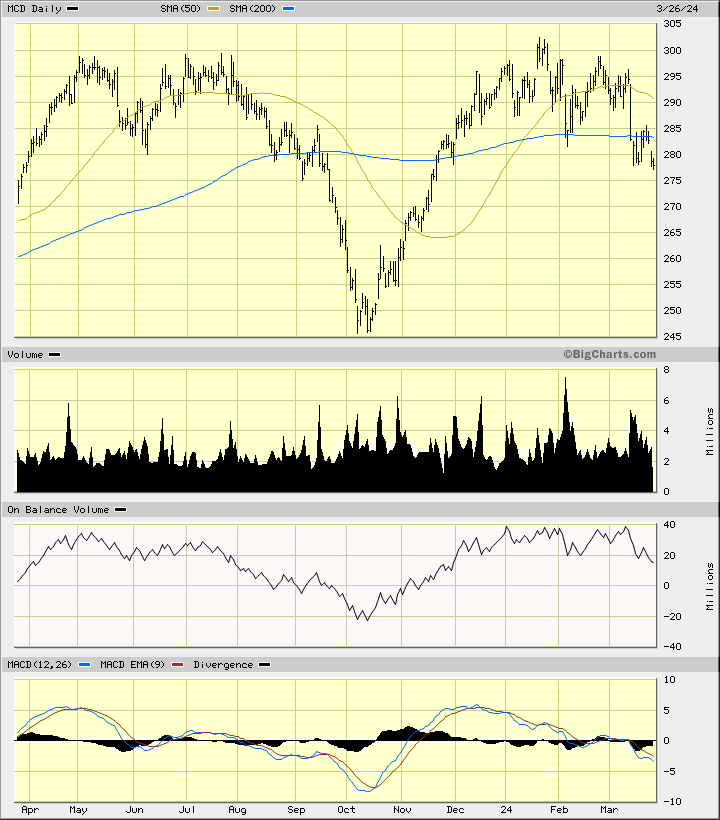
In this daily bar chart of MCD, below, I can see that prices have slipped lower and now trade below the declining 50-day moving average line and the weakening 200-day moving average line. The trading volume has been more active since October.
The On-Balance-Volume (OBV) line has rolled over and weakened the past three months. The trend-following Moving Average Convergence Divergence (MACD) oscillator has been weakening since December and is now below the zero line in sell territory.
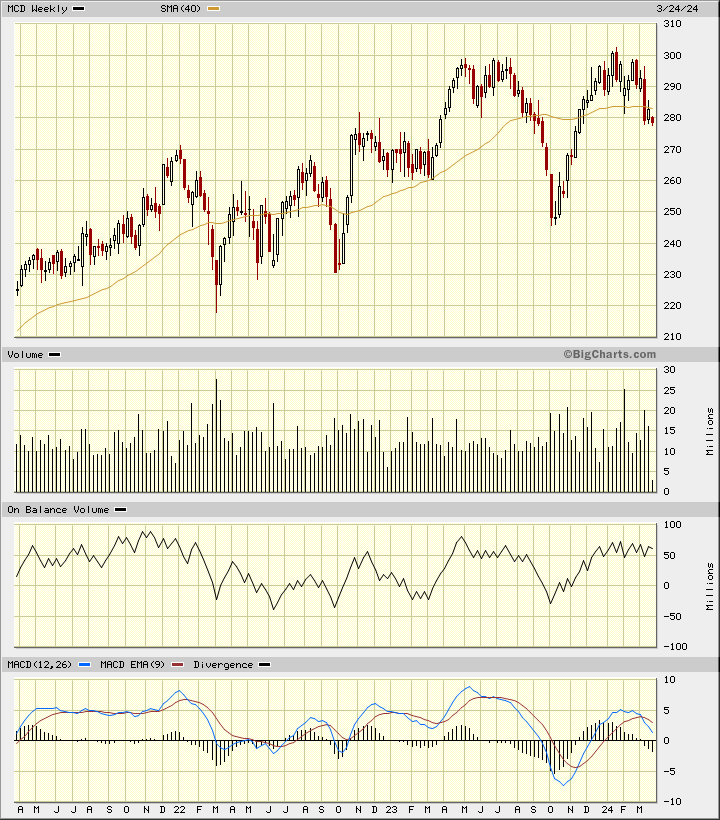
In this weekly Japanese candlestick chart of MCD, below, I can see a potential double top formation with twin peaks in the $300 area. Prices have closed below the 40-week moving average line which now has a negative slope.
The weekly OBV line has been stalled and has formed a similar double top. The MACD oscillator has made a lower high than seen in May and has crossed to the downside for a take profit sell signal.
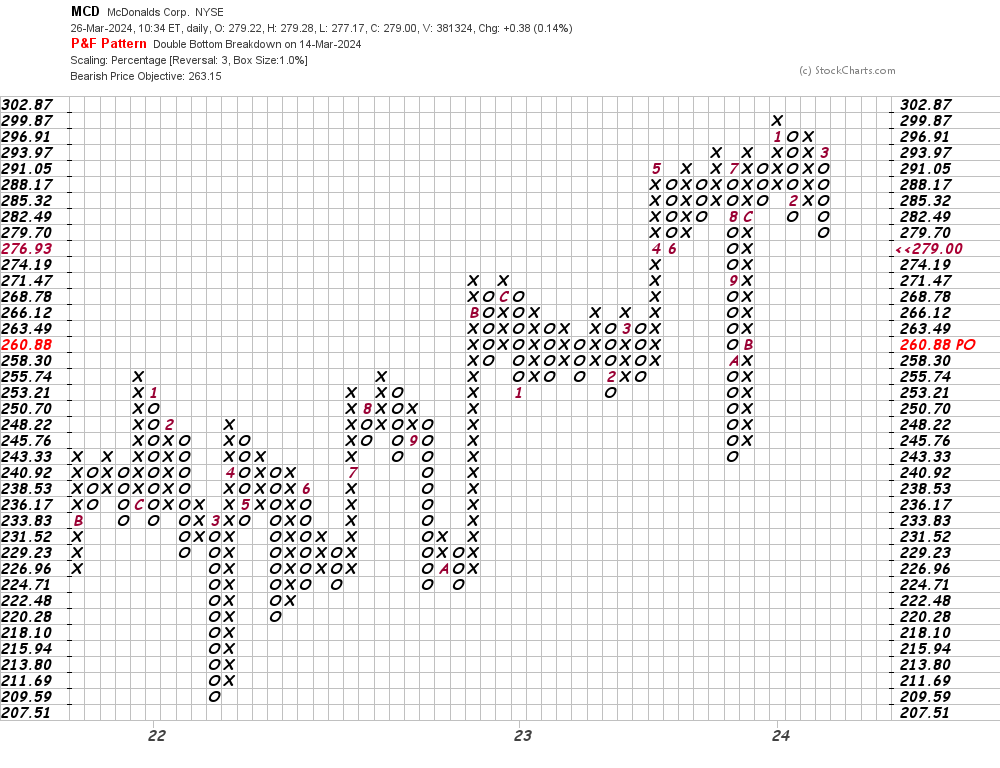
In this daily Point and Figure chart of MCD, below, I can see a potential downside price target in the $263 area.
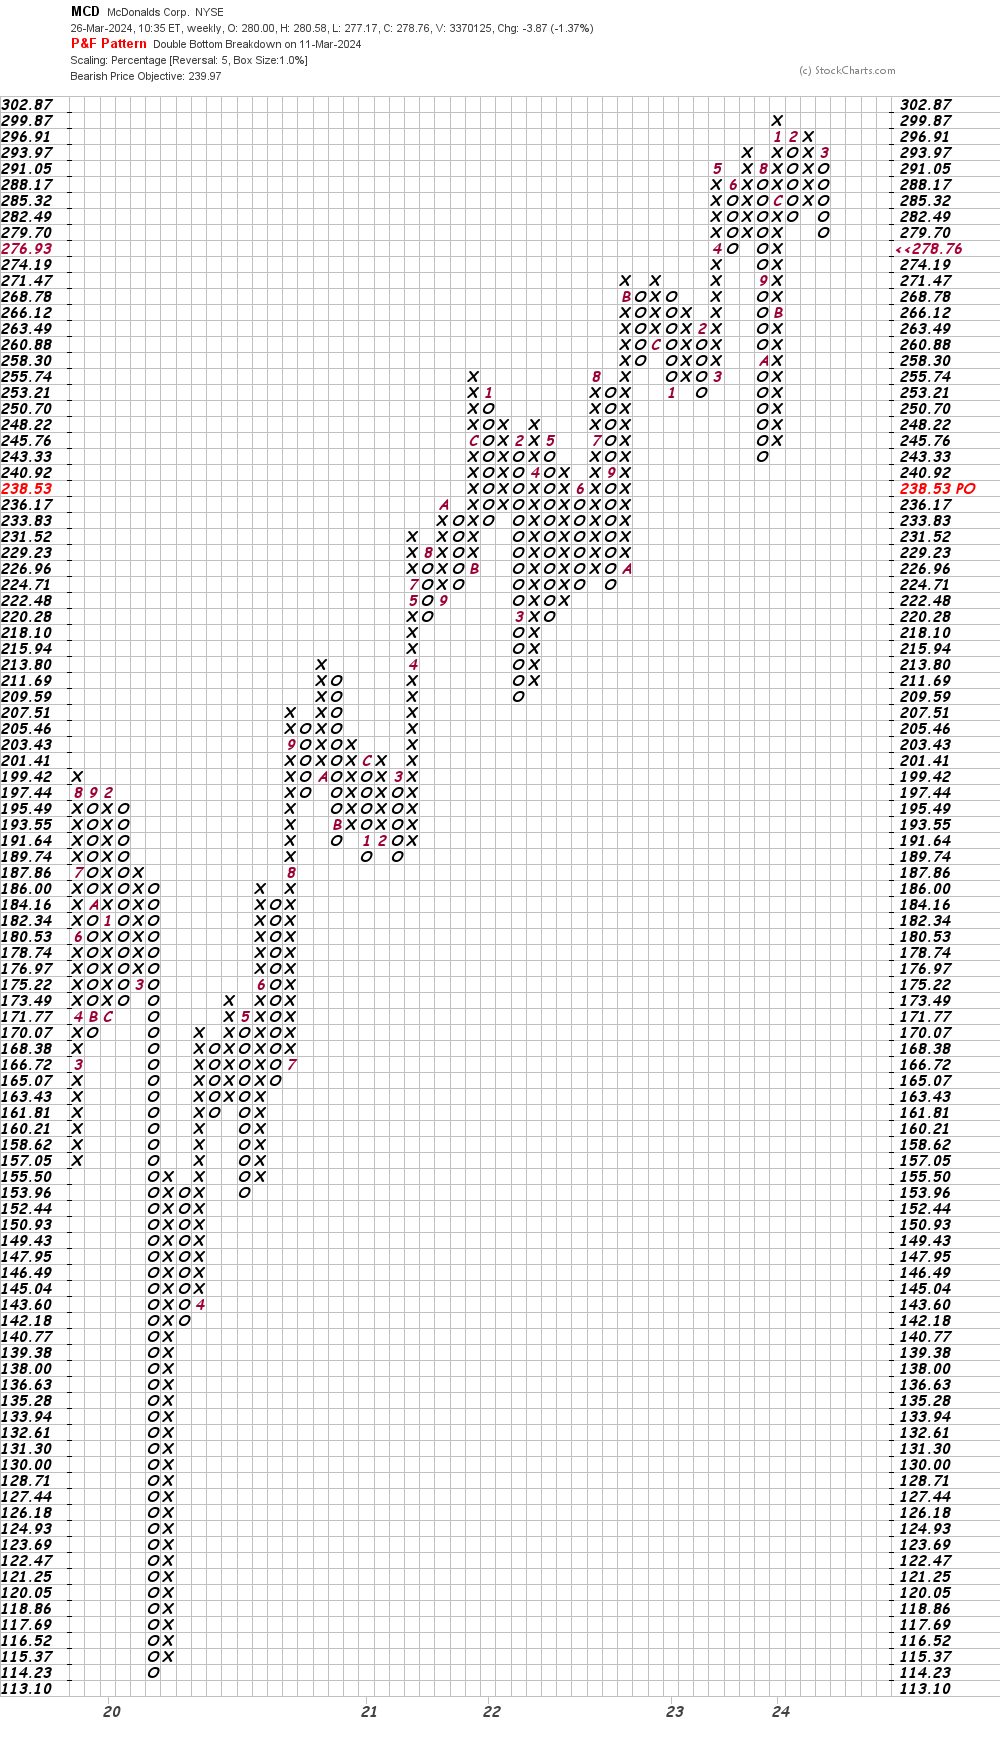
In this second Point and Figure chart of MCD, below, I used weekly price data with a five box reversal filter. Here the software suggests a price target in the $240 area.
Bottom line strategy: While some may think that offering Krispy Kreme donuts is a great idea, but the best idea that MCD did, in my opinion, was to up their game with better coffee. I don't expect donuts to move the needle but I do look for the share price of MCD to weaken further in the days and weeks ahead.
Employees of TheStreet are prohibited from trading individual securities.