Will Alcoa Continue to Be Ignored in the Metals Frenzy?
Here's how to approach the stock.
You've reached your free article limit
You've read 0 of 1 free Pro articles.
Metals giant Alcoa AA has been ignored in the media rush in copper and precious metal names lately.
Let's check out the charts and indicators of AA to see what opportunities lie ahead.
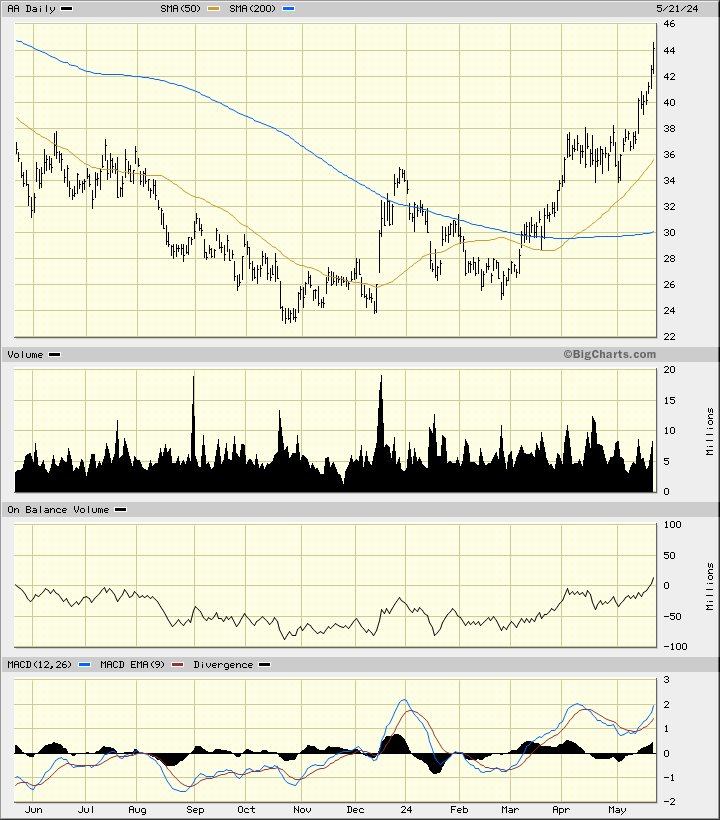
In this daily bar chart of AA, below, I can see that prices made a bottom pattern earlier this past year and made an upside breakout in April. Prices made a sideways consolidation in April before renewed strength in May.
AA trades above the rising 50-day moving average line and above the now rising 200-day moving average line. Trading volume looks like it has been more active since the middle of December and tells me that investor interest has increased. This is a positive development.
The On-Balance-Volume (OBV) line shows a bottom pattern and a turn higher from March as buyers of AA became more aggressive than sellers. The Moving Average Convergence Divergence (MACD) oscillator is in a bullish alignment above the zero line.
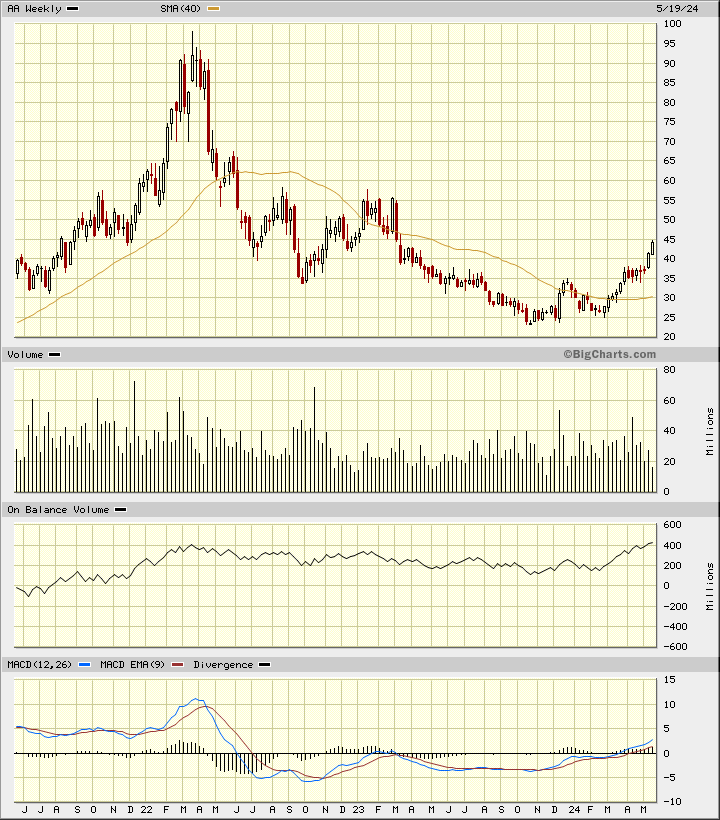
In this weekly Japanese candlestick chart of AA, below, I see a positive setup for further price gains. Prices trade above the bottoming 40-week moving average line.
The weekly OBV line shows improvement the past four months. The MACD oscillator is above the zero line in bullish territory. The candles are pointed higher with no signs of a top reversal yet.
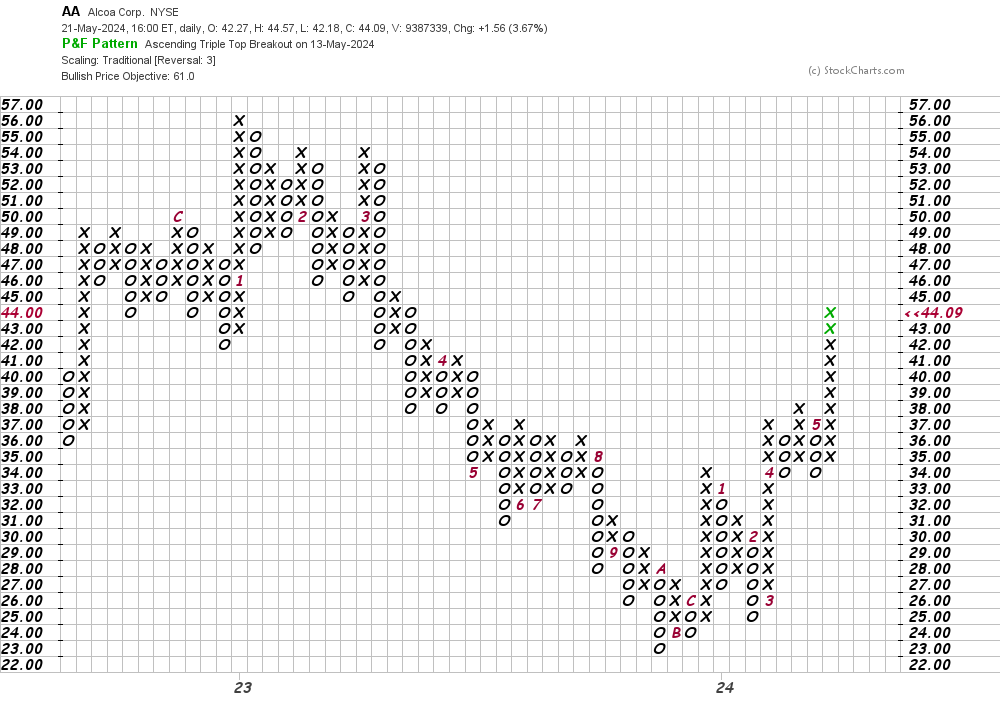
In this daily Point and Figure chart of AA, below, I can see that the software has analyzed the Xs and Os and is projecting an upside price target in the $61 area.
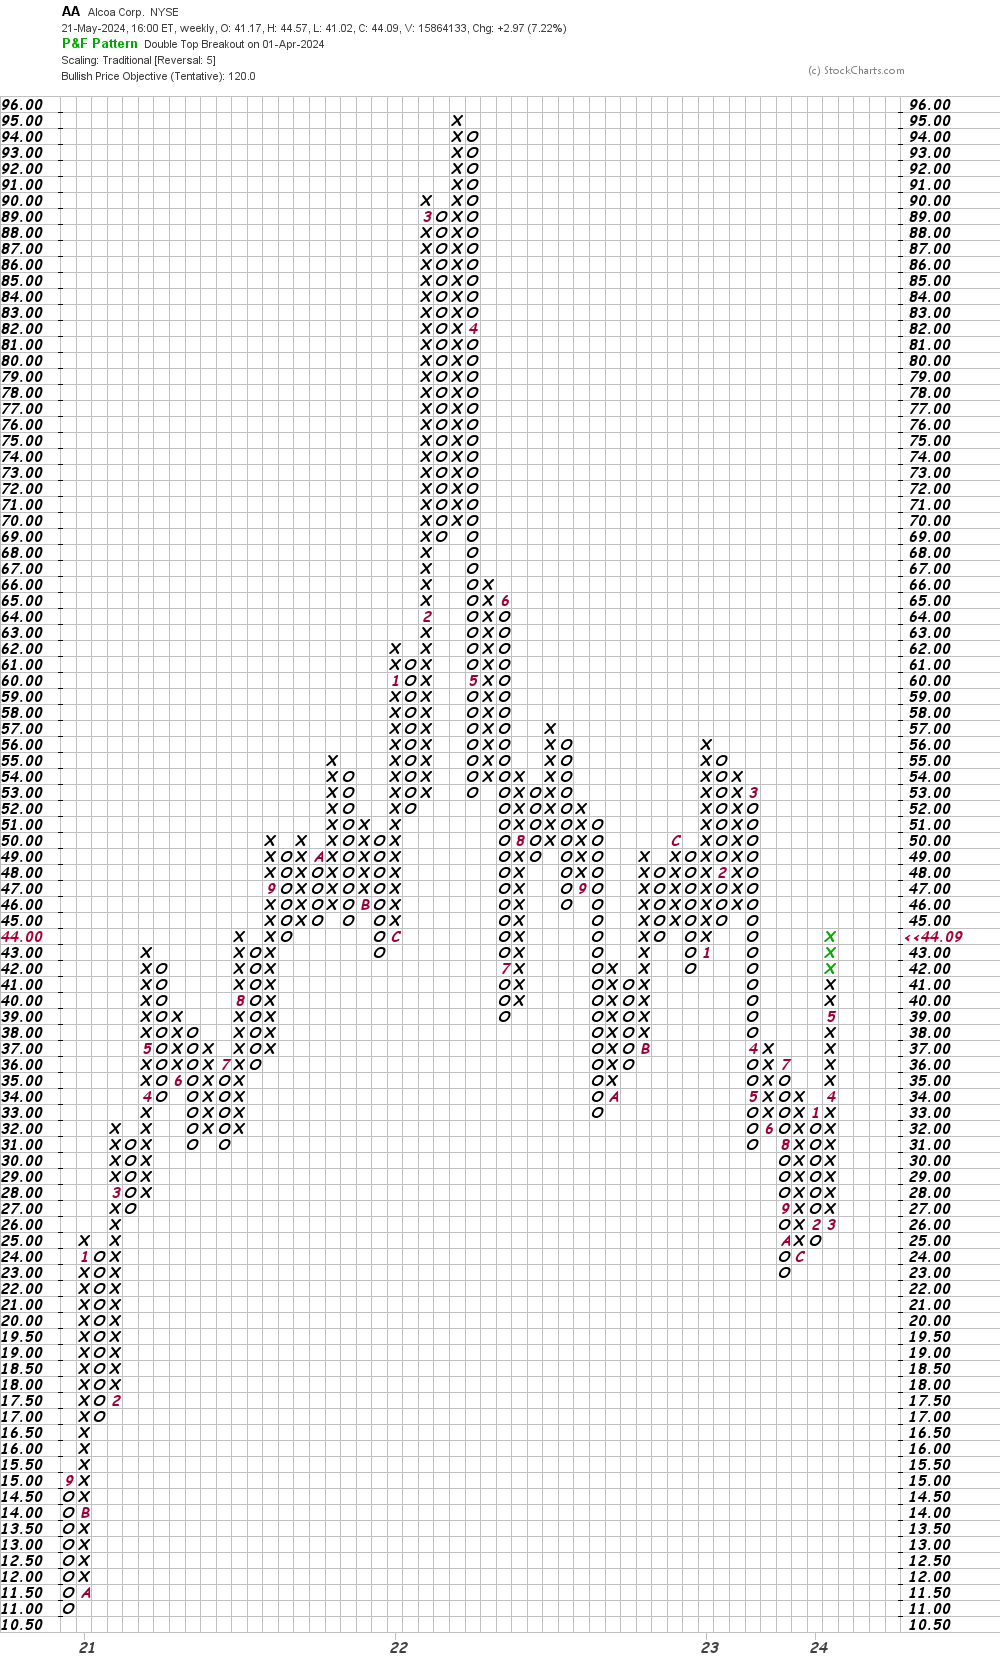
In this second Point and Figure chart of AA, below, I used a five box reversal filter and here the weekly software yields us a longer-term price target of $120.
Bottom line strategy: I was bullish on AA in my update of April 15, and traders should continue to operate from the long side. Raise sell stops to $38. The low $60's is my price target for now.
Employees of TheStreet are prohibited from trading individual securities.