Why I Wouldn't Add to Costco at This Level
Even though its numbers beat Wall Street expectations, there's some risk with the wholesale giant.
You've reached your free article limit
You've read 0 of 1 free Pro articles.
The firm that many investors feel is the best-run large retailer in the nation, if not the world, released its fiscal fourth quarter financial results on Thursday evening.
No offense to Sarge-name Walmart WMT, but I speak of Costco Wholesale COST. For the 16-week period ended September 1, 2024, Costco posted a GAAP EPS of $5.29 on revenue of $79.697 billion.
These numbers beat Wall Street's expectations at the bottom line quite handily and compare well to the year-ago comp of $4.86. However, the top-line print fell short of consensus view, while reflecting year-over-year growth of just 1%. While the softer-than-expected growth in sales might be partially explained by the fact that the firm's Q4 2024 was one week shorter than was the firm's Q4 2023. The improved profitability, however, can also be partially explained by a one-time tax benefit of $63 million, which added $0.14 per share to the reported EPS number.
I have one more "however." Comp sales, however, reflect sales data from comparable locations a year ago, over comparable weeks. Therefore, the calendar does not line up perfectly. Comp sales across the company were up 5.4% or 6.9% adjusted to exclude the impacts of gasoline prices and currency exchange rates. Broken out, U.S. comp sales were up 5.3% or 6.3% adjusted, Canadian comp sales were up 5.5% or 7.9% adjusted, other international comp sales were up 5.7% or 9.3% adjusted, and finally... E-commerce comp sales were up 18.9% or 19.5% adjusted.
Operations
As revenues grew (albeit on one less week) 1% to $79.697B, operating expenses increased 0.5% to $69.588B. That left an operating income of $3.042B (+9.4%), which put the firm's operating margin at 3.89%, up from 3.59% and slightly better than expectations. After accounting for interest, other income and taxes, net income printed at $2.354B (+8.9%). That works out to $5.29, up 8.8% from $4.86 for the year ago comparison.
Fundamentals
For the full year, Costco generated operating cash flow of $11.339 billion. Out of that number came capex spending of $4.71 billion, leaving free cash flow of $6.629 billion. Out of that number came cash dividend payments of $9.041 billion and share repurchases of $700 million. While this is an imbalance uncharacteristic of Costco, remember that the firm paid shareholders a special dividend of $15 per share on top of their regular dividend this past January.
Looking at the balance sheet, Costco ended the period with a cash position of $11.144 billion and inventories of $18.647 billion. This puts current assets at $32.246 billion. Current liabilities add up to $35.464 billion, including $2.501 billion in deferred membership fees, which are not financial obligations and $2.435 billion, which are not entirely financial obligations. This brings the firm's current ratio to a shaky 0.91 at the headline, but 0.99 adjusted for deferred fees and a more acceptable 1.06 when adjusted for deferred fees and accrued membership rewards. Still not a perfect current situation, by any stretch.
Total assets amount to $69.831 billion. This includes nothing intangible, which I am sure Costco easily could pad value that way. We appreciate that. Total liabilities less equity comes to $46.209 billion including $5.794 billion in long-term debt. Costco could pay that almost twice over out of pocket. The balance sheet on the whole is in far better shape than is the current situation.
Wall Street
Since these earnings were released last night, I have come across 12 highly-rated (four-plus stars at TipRanks) sell-side analysts that have opined on COST. After allowing for changes, among those 12 analysts, there are eight "buy" or buy-equivalent ratings and four "hold" or hold-equivalent ratings. One of those "buys" as well as one of those "holds" chose not to set a target price. That leaves us with 10 targets to work with.
The average target price across the 10 remaining analysts is $931.30 with a high of $1,005 (Laura Champine of Loop Capital Markets) and a low of $800 (Paul Lejuez of Citigroup). Once omitting those two as potential outliers, the average target across the other eight rises to $938.50. Because you were going to ask, the average "buy" target stands at $970, while the average "hold" target is currently $841.
My Thoughts
The business is doing well. The comparable sales are great, which I think is a better metric than comparing dollar amounts from two periods of differing lengths a year apart. That said, there is some risk. The firm has not yet truly realized the increase in membership fees that just took place about four weeks ago. That's a positive, but one that will not be felt for almost a year. Then there's the possibility of a longshoreman strike that will impact seaports on the east coast of the U.S. as well as the Gulf of Mexico. That is likely why inventories were a little elevated in this edition of the firm's balance sheet. The stock remains expensive, trading at 51-times forward-looking earnings.
That's one reason why I have remained long Walmart. Both stocks have had a very good year to date, with WMT up 52% and COST up 33.4%, but even at 32 times, WMT is expensive, but far less so. I think these are the only two large-sized retailers that I have interest in. Translate that as: I have no interest in Target TGT, even at just 16-times forward-looking earnings, that stock is up just 9.4% this year. Its balance sheet is far from impressive to boot.
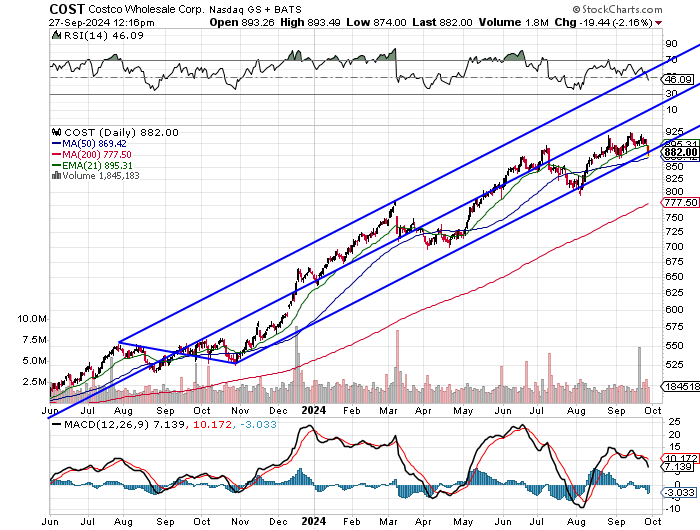
That might just be the Pitchfork model of all-time. Let's zoom in:
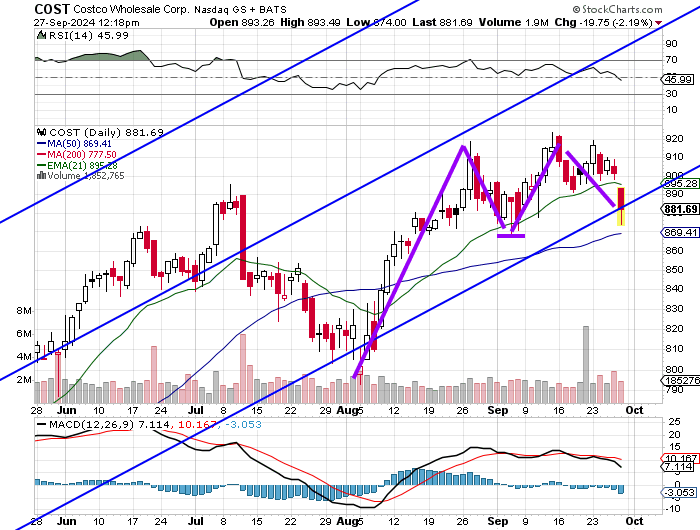
Readers will see a double-top reversal pattern with an $869 pivot. Relative strength is neutral and the daily MACD has taken on a more bearish posture. Additionally, the stock came close to testing that pivot this morning, which just happens to also be its 50-day SMA.
I would not initiate a long position or add to an existing long position at this level, too close to a potential downside pivot. Sure, if it holds... you're a hero. The risk is that the level cracks. The 200-day SMA stands at $780. Should that 50-day line and that pivot fail, and should there be a strike, that 200-day line is very realistic.
At the time of publication, Guilfoyle was long WMT equity.
