Where’s the Bull? Charting Everything from McDonald’s to Donald Trump
Gold, presidential election arbitrage, McDonald’s, Nvidia, Chipotle, Super Micro Computer. We're charting it all and more this week.
You've reached your free article limit
You've read 0 of 1 free Pro articles.
Charts of the Week: Gold and the U.S. Dollar Index
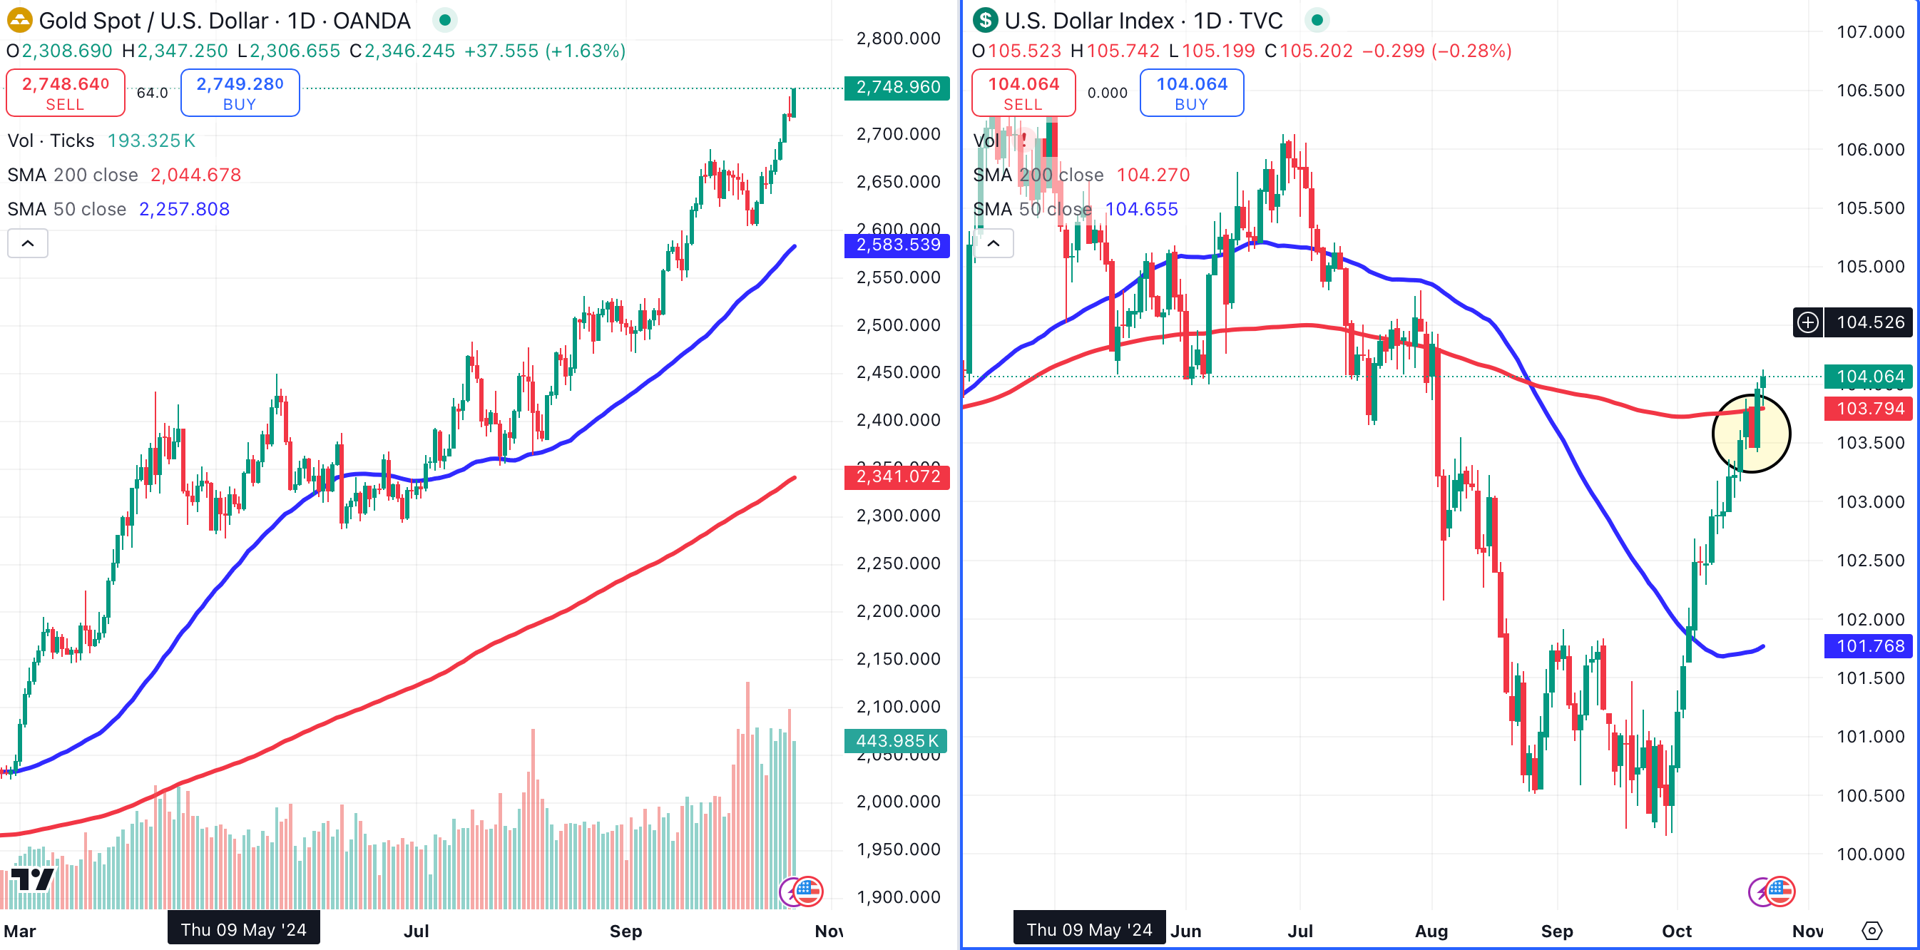
Throw away your textbooks! The U.S. Dollar Index/Gold inverse correlation is broken.
Normally, gold and the greenback move in opposite directions. You can find this inverse correlation in every economics textbook.
However, since the start of this month, gold (left) and the dollar (right) have rallied together. The dollar index has gained about 3.7% since the start of the month, while gold has gained about 4%.
The dollar could see further gains, thanks to a bullish engulfing candlestick pattern (circled) that has formed over the past few days.
Why is the dollar getting so much love? Fed rate cuts that were priced in earlier this year are now being reversed, thanks to strong readings in retail sales and non-farm payrolls.
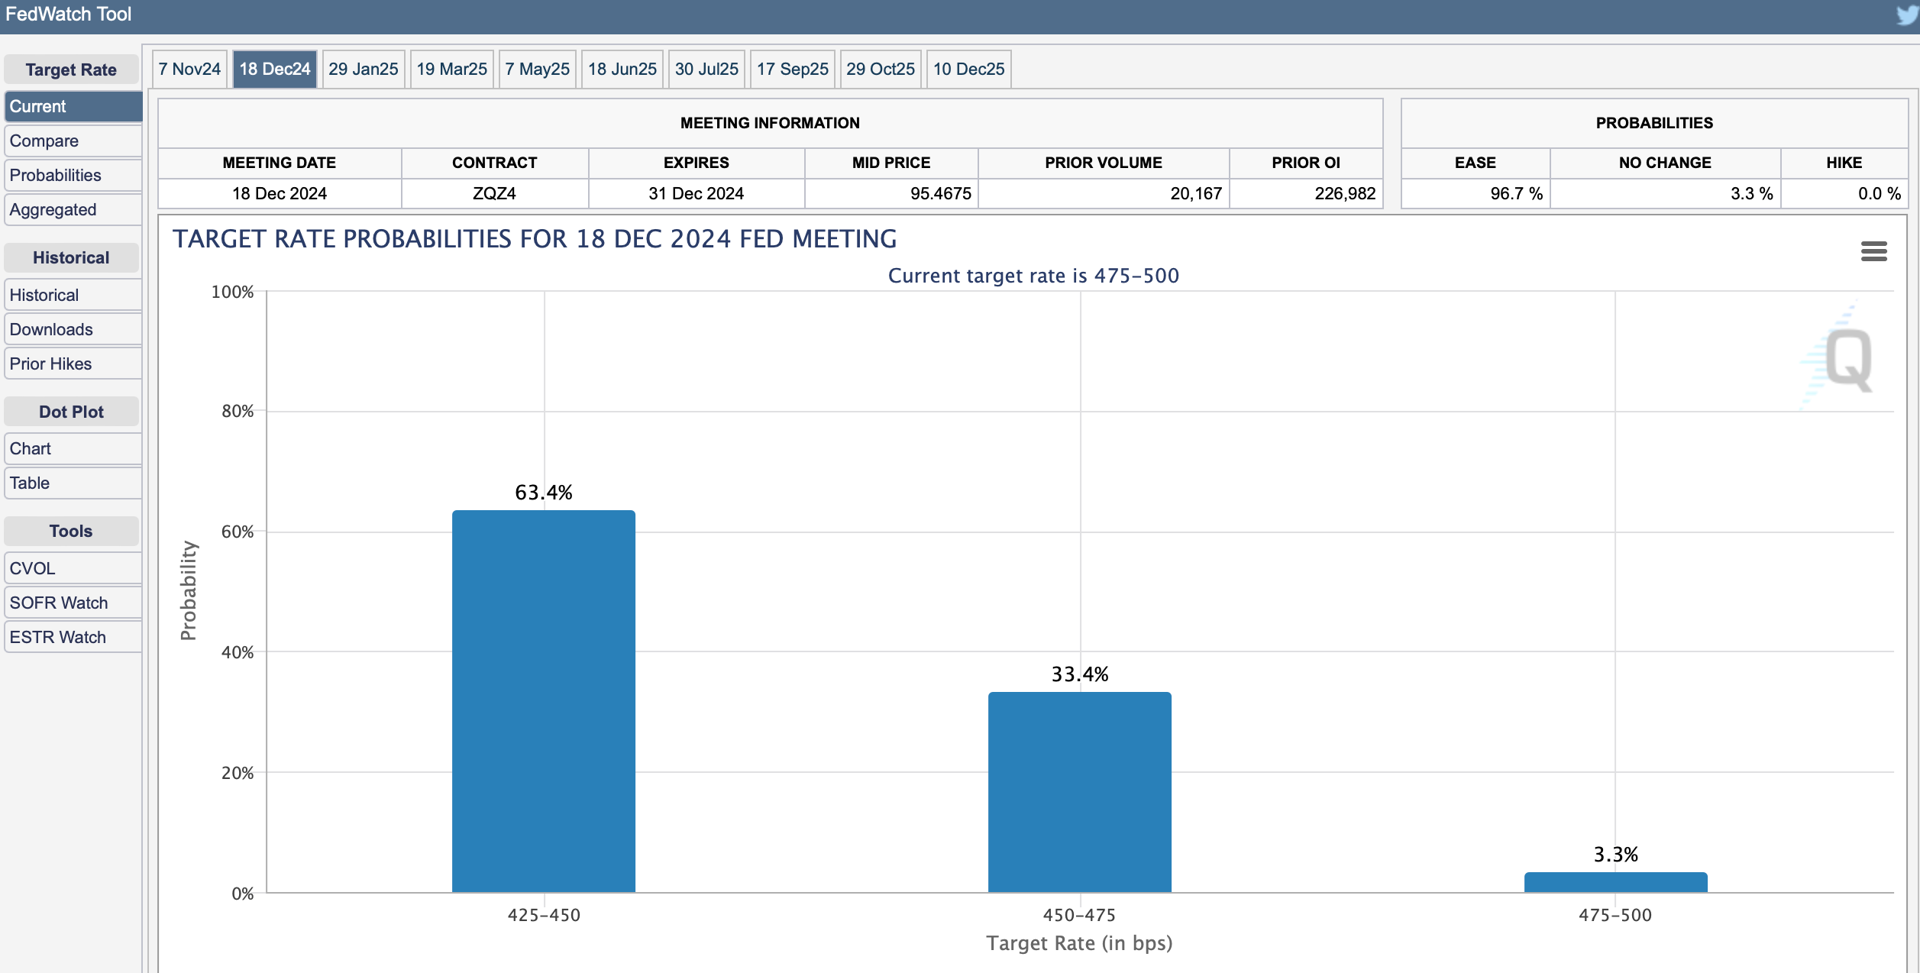
For November, the CME’s FedWatch tool now predicts a 90% chance of a 25 basis point FOMC rate cut, and a 10% chance of no move at all. There is also a 63% chance of a total of 50 basis points across the final two Fed meetings of 2024, and a 33% chance of just one rate cut for the rest of the year.
The International Monetary Fund projects U.S. growth for 2024 at 2.8%. Inflation is above the 2% target rate, and stocks are near all-time highs. Taking these things into consideration, now isn’t an ideal time for a series of deep rate cuts.
Dow Jones Industrial Average and McDonald's
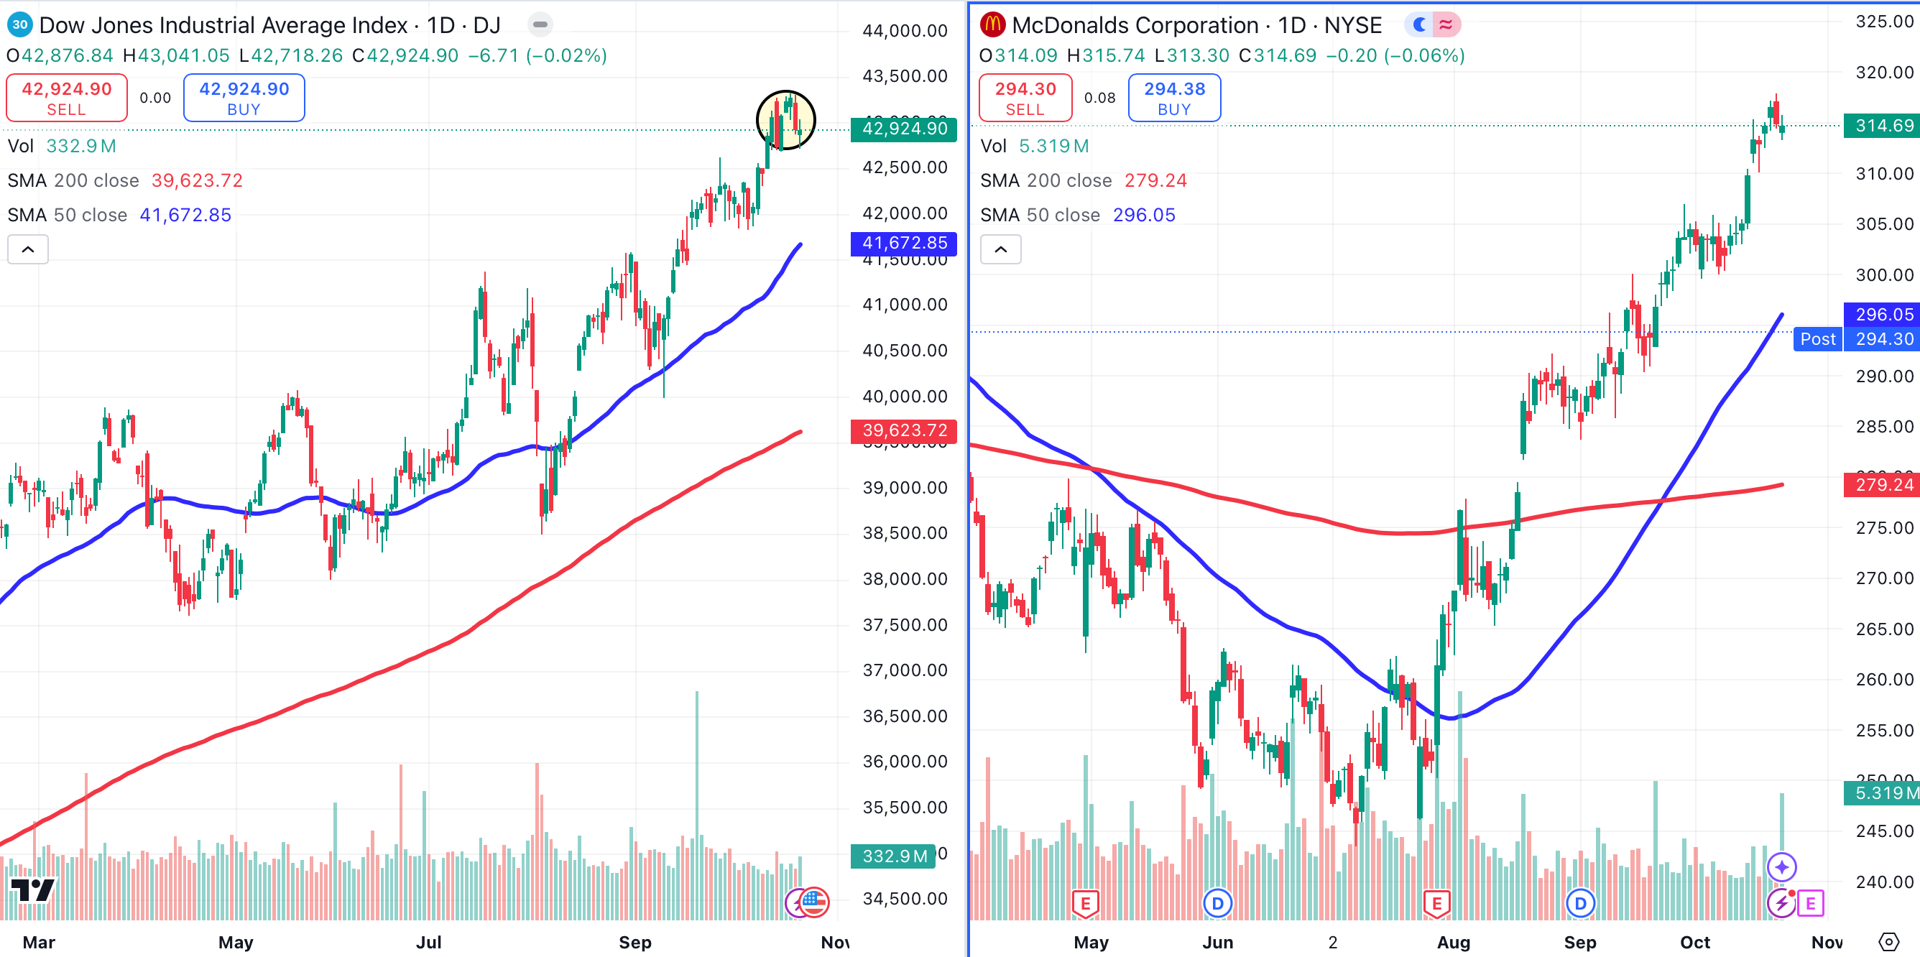
After closing at several consecutive all-time highs last week, the Dow Jones Industrials (left) lost a combined 0.8% on Monday and Tuesday. Is Dow component McDonald’s MCD (right) to blame?
Former President Trump was flipping burgers in my neighborhood on Sunday. The traffic caused by his appearance sent me on a quest for groceries, since I couldn’t get near my local supermarket.
This was great news for a small competing supermarket, as apparently all of Bucks County, PA. wound up there. Nobody was wearing red or blue. Instead, everyone was dressed in green on a Sunday morning in Eagles country.
Trading Trump?
I've been asked if it's possible to game the U.S. presidential election using betting sites like Polymarket and Kalshi. It's an intriguing possibility, because there are differing prices across these sites.
This creates the possibility of an arbitrage trade — buying on one market, and selling on another at a higher price. You wouldn't be betting on a candidate to win or lose. Instead, you're trying to capture the difference in prices.
For example, can we create an arbitrage trade by purchasing Trump contracts on Kalshi at 60...
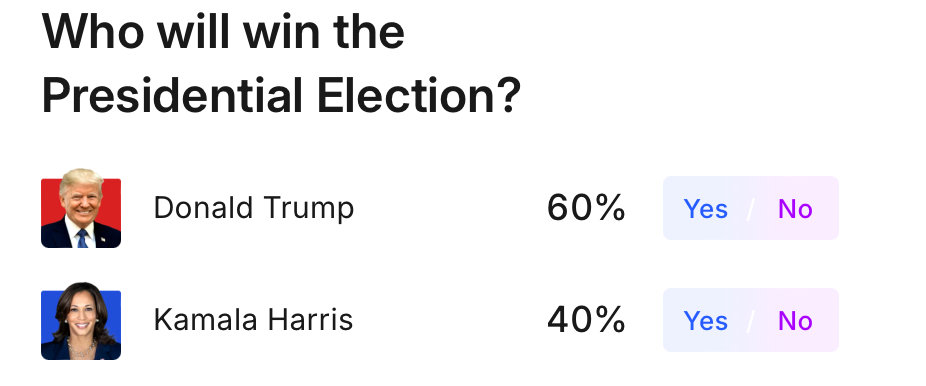
...and simultaneously selling Trump contracts on Polymarket at 63.9?
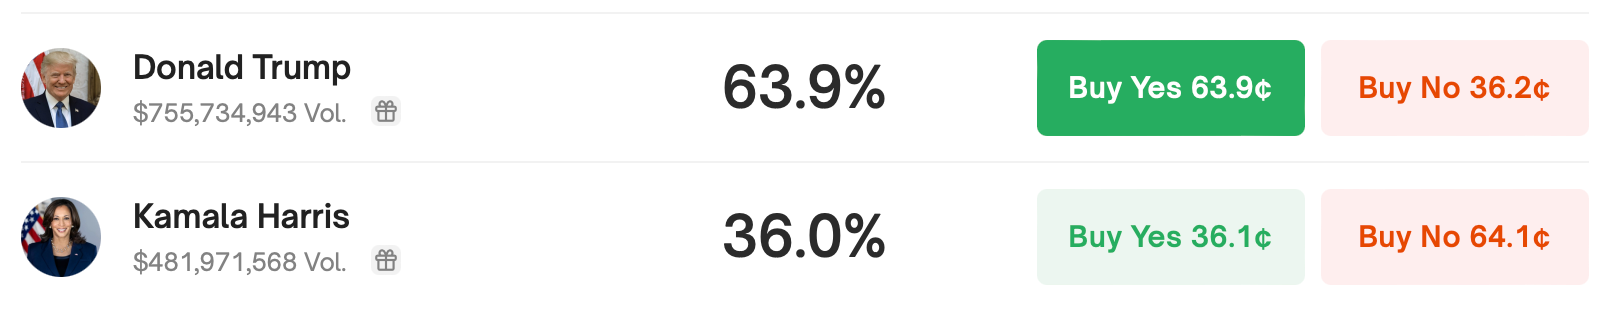
This type of arbitrage trade is possible, but there are huge caveats.
For one, these aren't liquid, regulated, standardized markets. Contract sizes vary, so it's not a simple apples-to-apples trade.
The spreads on some of these contracts can vary wildly, and that spread can eat your profit. The brokers are located in various countries, where rules are unclear, or their enforcement non-existent. Some, like Predictit, have seemingly random rules regarding withdrawals.
Bottom line: While an arbitrage across betting sites may look like an easy trade, it's really very complex.
More on McDonald's
McDonald’s was crushed after Tuesday’s close after the company was linked to an E. Coli outbreak. McDonald’s stock fell from $314 to $295 after Tuesday's close.
This news is tragic of course, but let’s consider the repercussions. What happened the last time a major U.S. fast food chain was in a similar situation?
Chipotle and Wendy's
From 2015 through 2018, Chipotle Mexican Grill CMG (left) suffered a series of foodborne illness outbreaks. The stock bottomed out at a split-adjusted $5.30 in October of 2017.
Naturally, everyone was afraid to buy the stock at the time. The repetitive nature of the outbreaks even had some wondering if Chipotle would undergo a name change.
Since October of 2017, the stock has gained over 1,000%.
I expect McDonald’s to recover more quickly than Chipotle. The fast casual Mexican chain had a difficult time pinpointing the source of the outbreaks due to its complex supply chain.
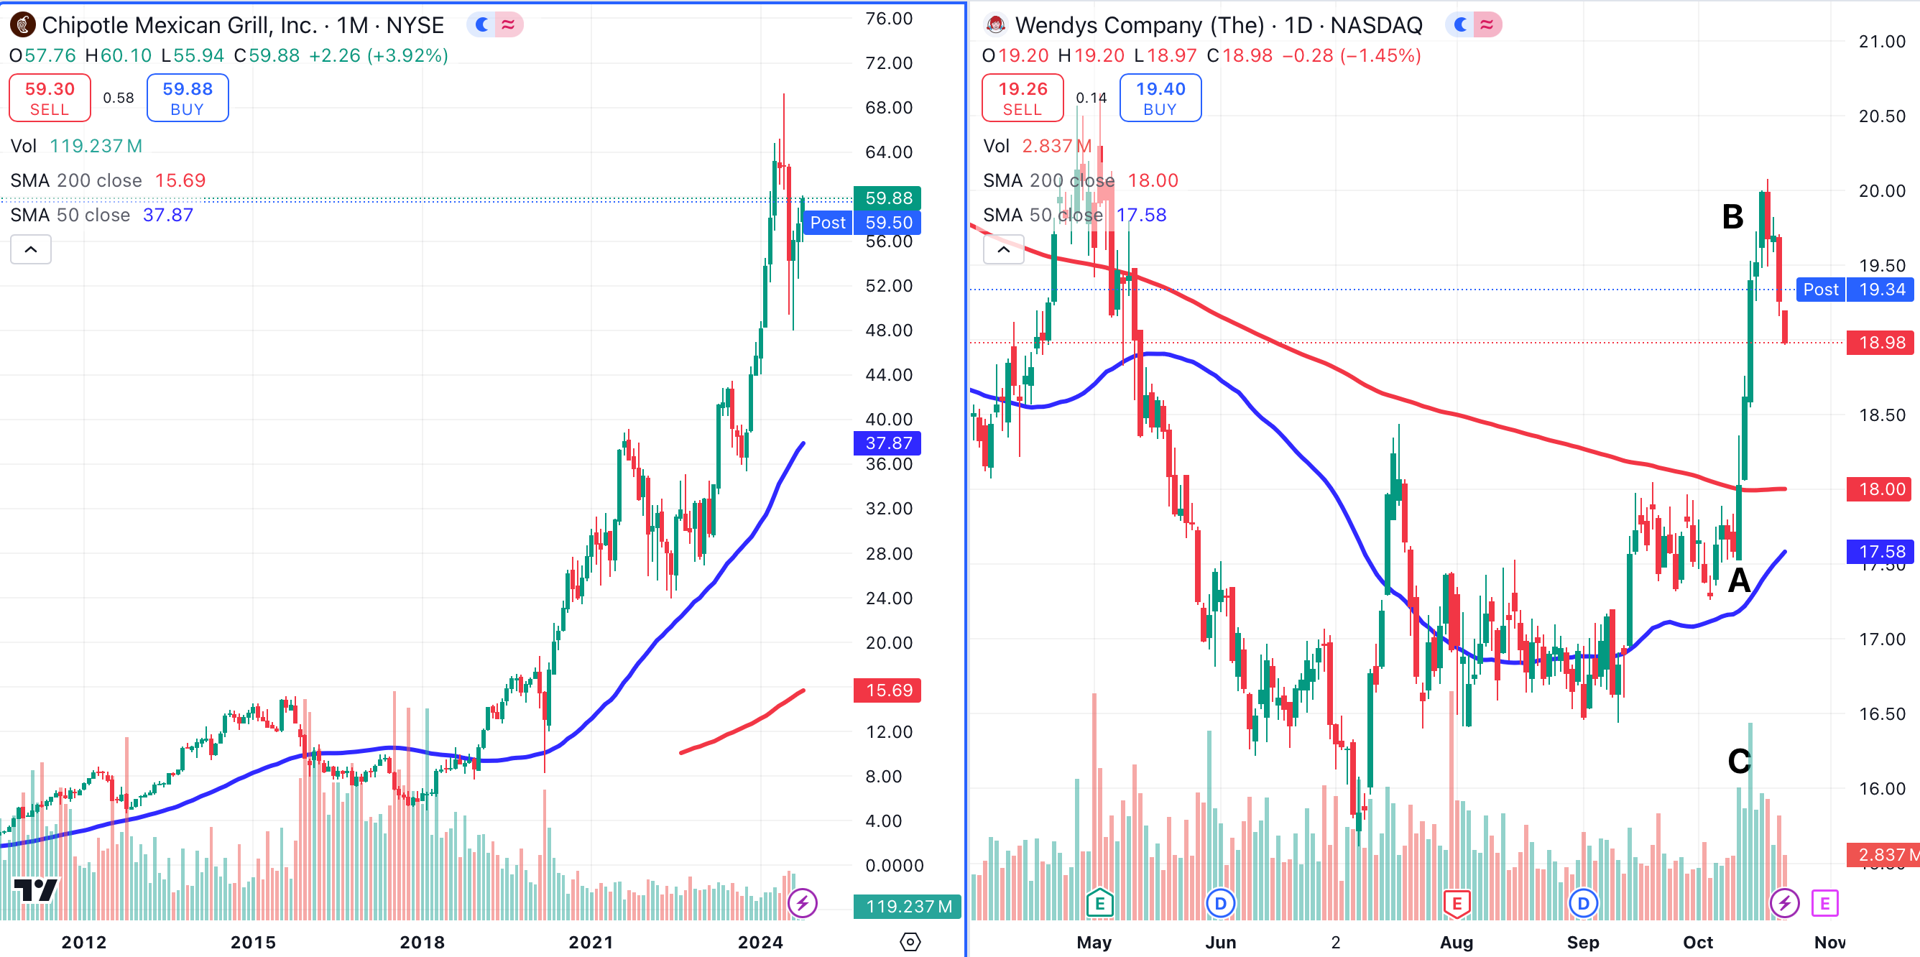
Fast-food provider Wendy’s WEN (right) has been cooking lately. From October 11 (point A) through October 17 (point B), this stock gained an impressive 11%. Volume picked up sharply over that stretch (point C).
Wendy’s jumped by about 3% after Tuesday’s close, as the company is likely to benefit from McDonald’s misfortune. Deutsche Bank recently raised its price target for Wendy’s from $18 to $20, but maintained a "hold" rating on the stock.
Now all Wendy’s needs to do is bring back those Clara Peller commercials from the ‘80s, and they’ll be cooking with fire.
Nasdaq 100 and Nvidia
Earlier this week, market darling Nvidia NVDA (right) smashed through resistance (red arrows) to close at an all-time high. Nvidia broke out of a symmetrical triangle consolidation (black dotted lines) and rocketed higher.
Meanwhile, the Nasdaq 100 (left) is still struggling to reach its old highs.
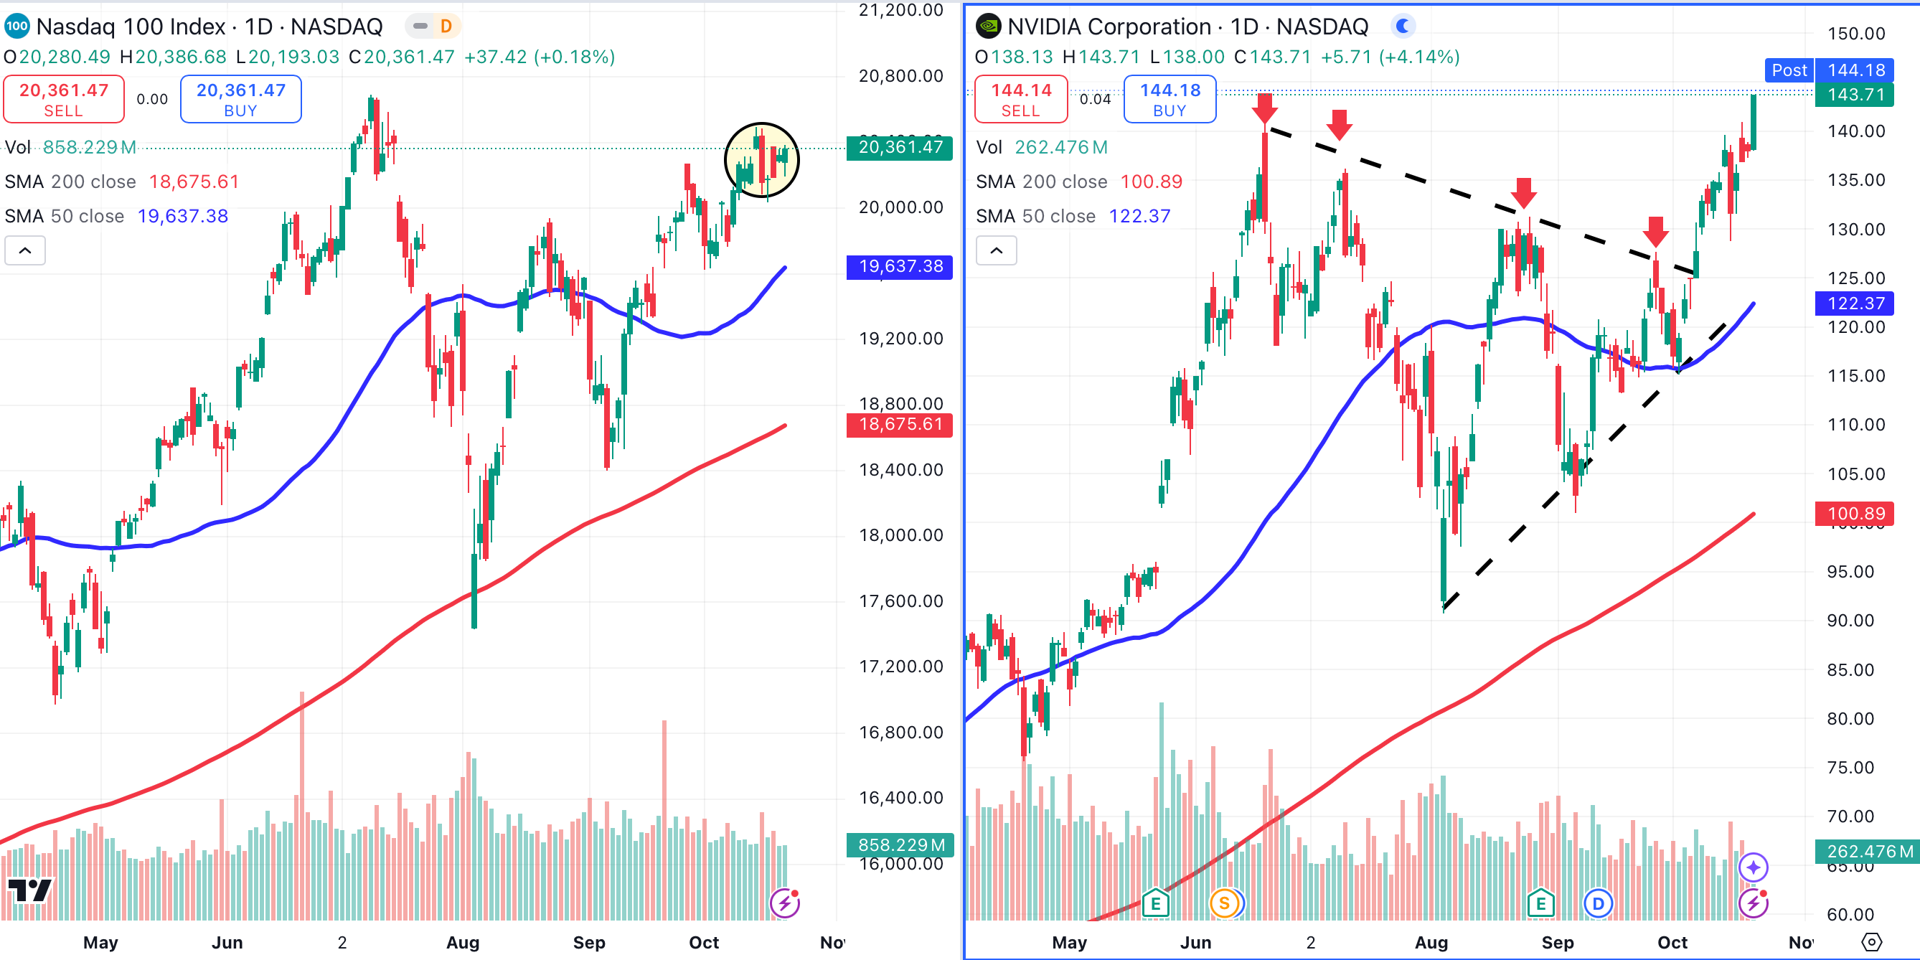
That could change soon. The tech-laden index has been consolidating prior gains (shaded yellow) for about two weeks. On both Monday and Tuesday, the Nasdaq closed green, while the three other major indexes finished in the red.
Before the end of this month, Microsoft MSFT, Apple AAPL, Meta Platforms META, Alphabet GOOGL, Amazon AMZN, and a slew of other tech names are scheduled to report earnings. Will earnings be the catalyst that drives the Nasdaq to new heights?
S&P 500 vs. UnitedHealth
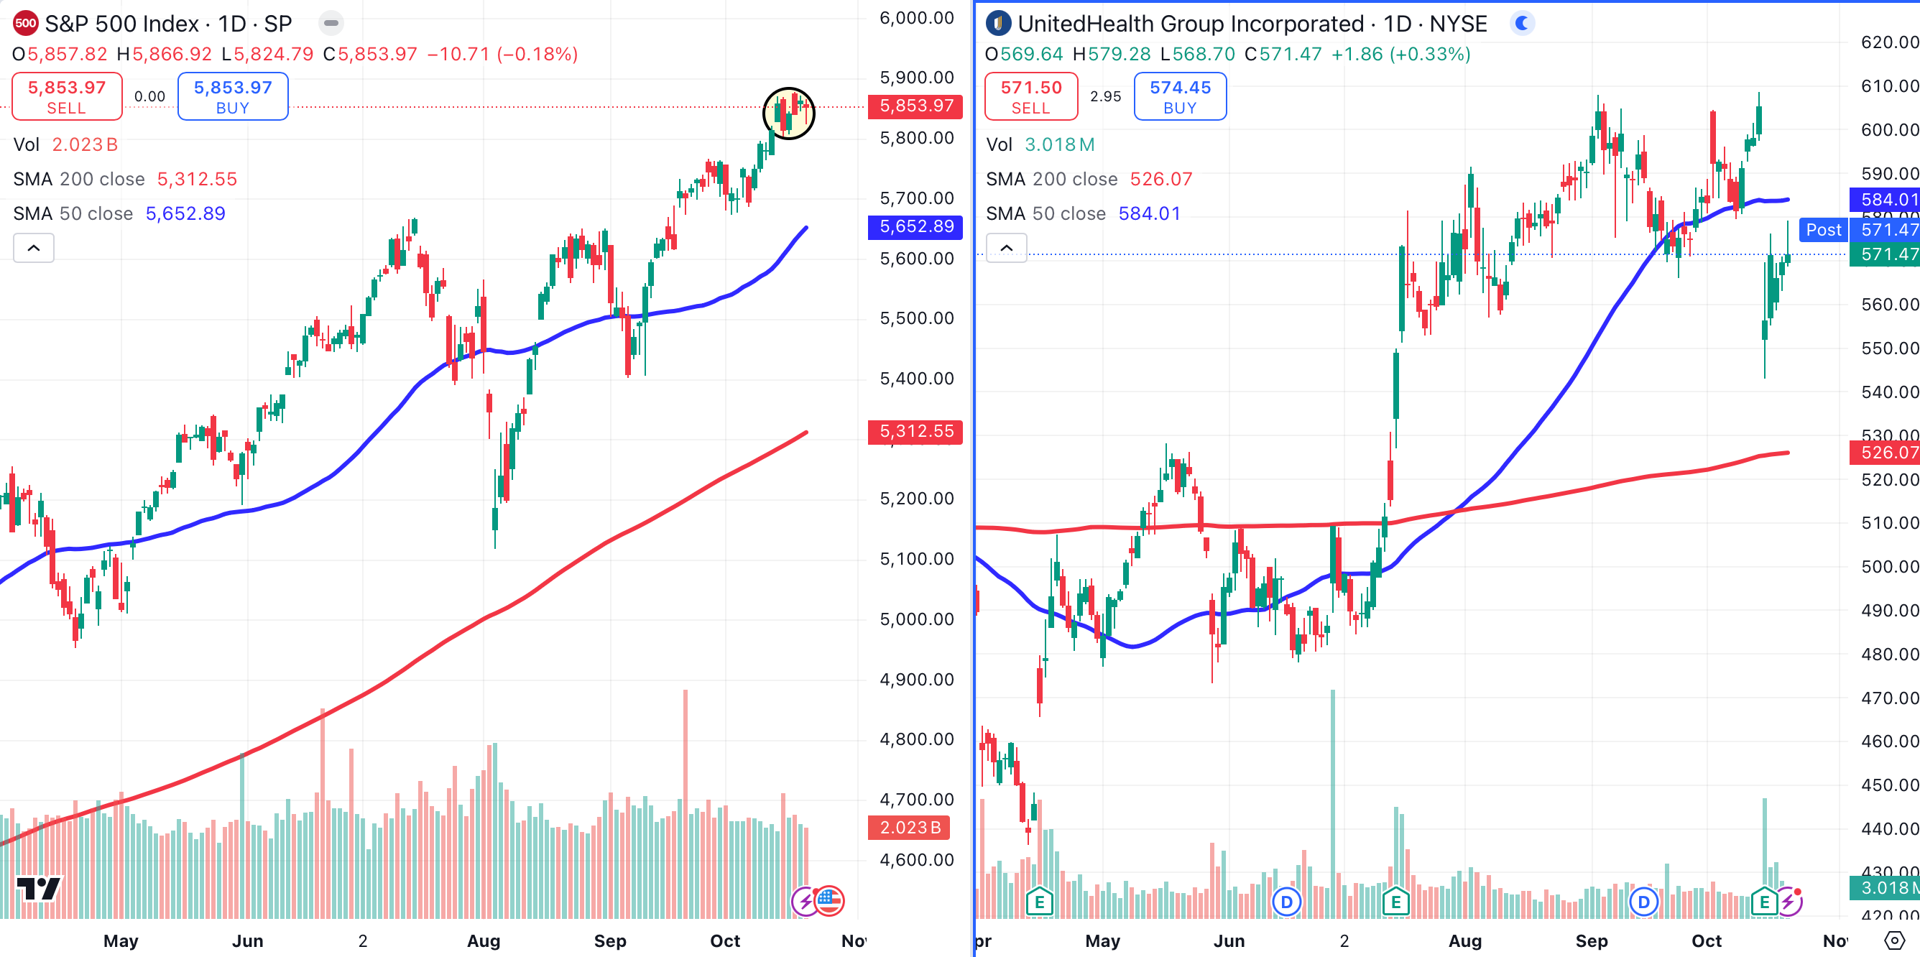
The S&P 500 (left), while trading just below its all-time closing high, has stalled a bit (circled) ahead of peak earnings season. Top ten S&P 500 component UnitedHealth Group UNH dropped sharply on October 15 despite beating Wall Street estimates on both earnings and revenue.
Russell 2000 and Super Micro Computer
The Russell 2000 (left) continued to do what it does best — fail at resistance. The small-cap index has been trying unsuccessfully since July to break through 2300 (shaded yellow).
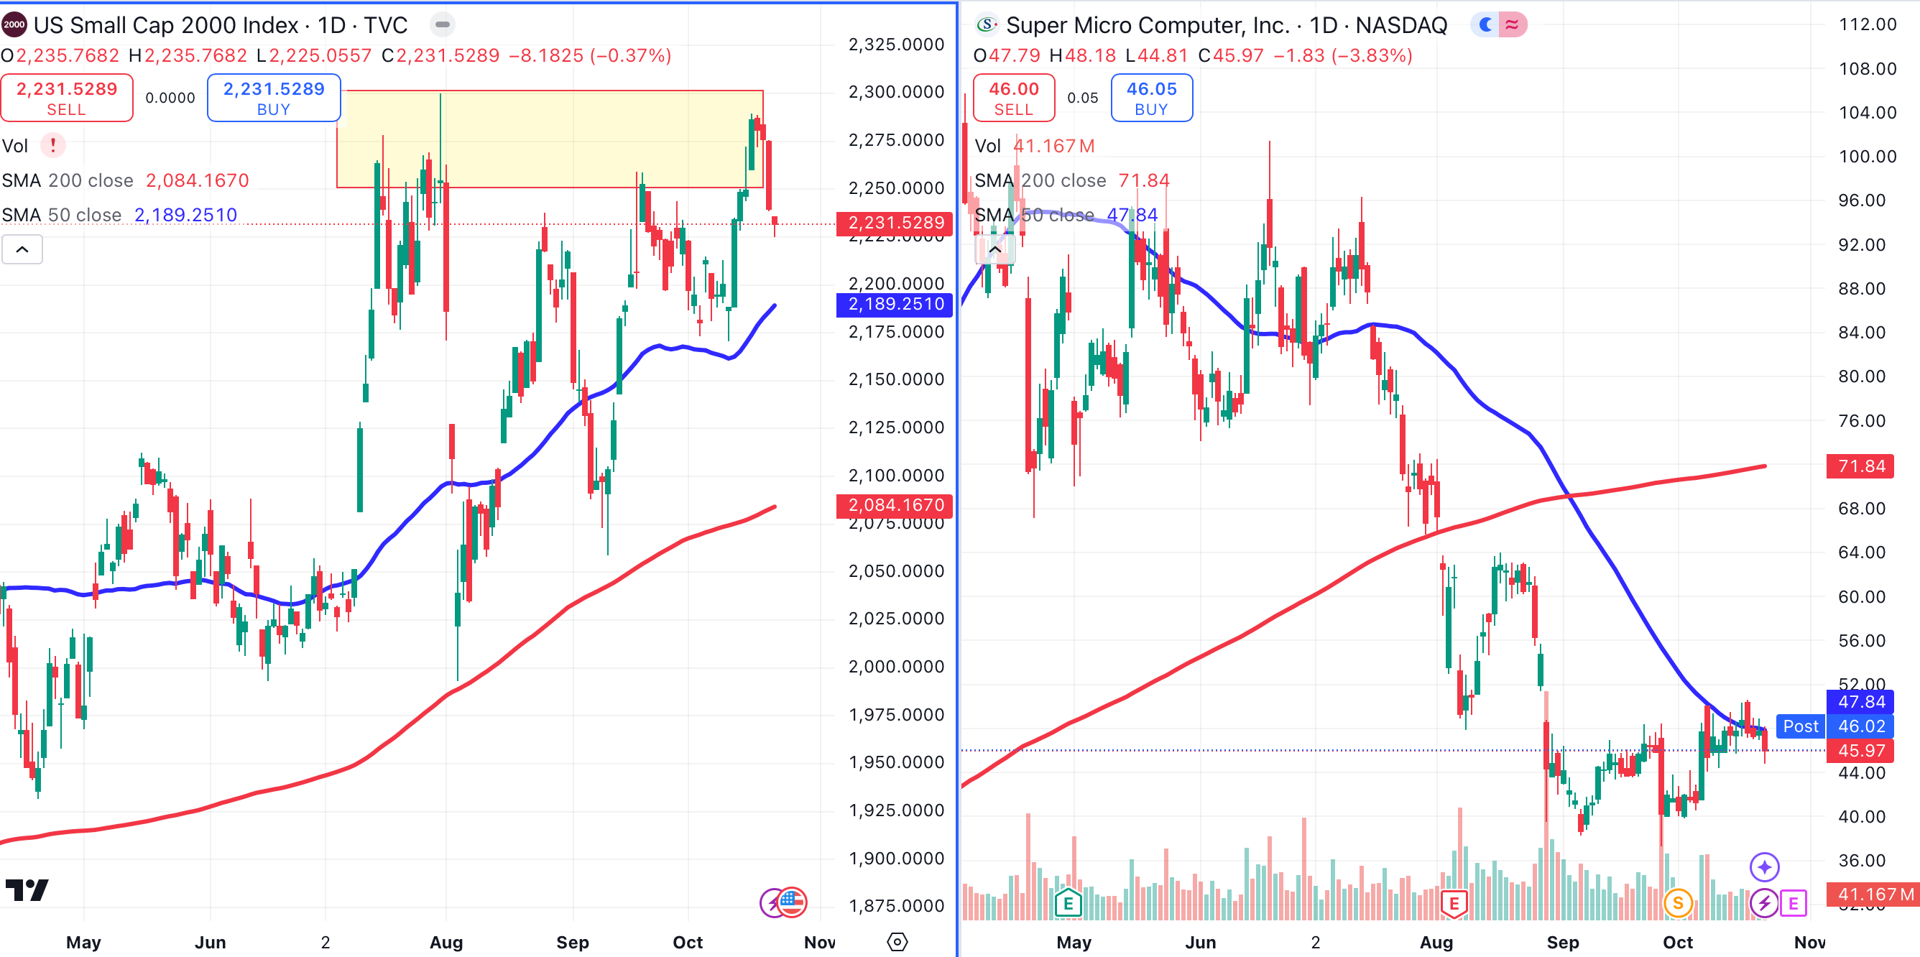
Super Micro Computer SMCI (right) left the Russell 2000 at the end of June. Since then, the stock has lost just over 40% of its value. SMCI, which was hit by a negative report from short-seller Hindenburg Research, is struggling to close above its 50-day moving average (blue).
At the time of publication, Ponsi had no positions in any securities mentioned.