What's Next for Eli Lilly Stock After Alzheimer's Drug Gets Nod From FDA Panel?
Let's check the charts for guidance.
You've reached your free article limit
You've read 0 of 1 free Pro articles.
Pharmaceutical giant Eli Lilly LLY has reached another record high as donanemab, its experimental Alzheimer's drug, received the endorsement of an FDA advisory panel.
The FDA's Peripheral and Central Nervous System Drugs Advisory Committee (a mouthful) voted on two key questions: Does donanemab appear to work for all patients with early Alzheimer's disease — or only those with evidence of a protein called tau in the brain? Further, do the benefits of this drug appear to outweigh the risks?
The stock has been moving in a positive direction. Let's check the charts.
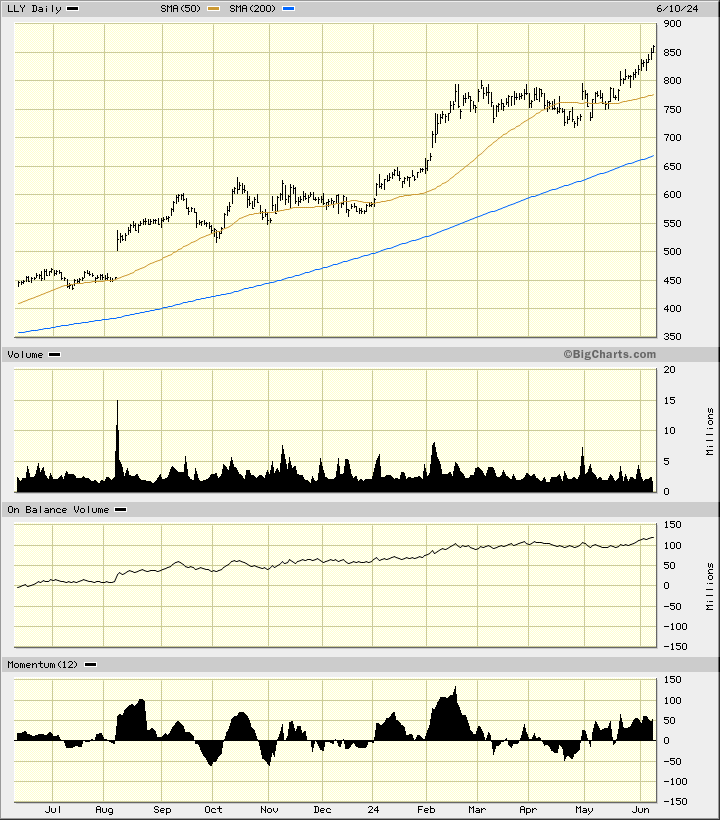
In the daily bar chart of LLY, below, I can see that the shares have climbed higher the past 12 months and have nearly doubled in price. LLY trades above the rising 50-day moving average line and above the rising 200-day moving average line.
The On-Balance-Volume (OBV) line shows us a steady rise the past year. The 12-day price momentum study shows us a high in February and a lower higher now in price momentum even though prices have made a higher high. This is a bearish divergence. LLY has ignored other bearish divergences in the past year.
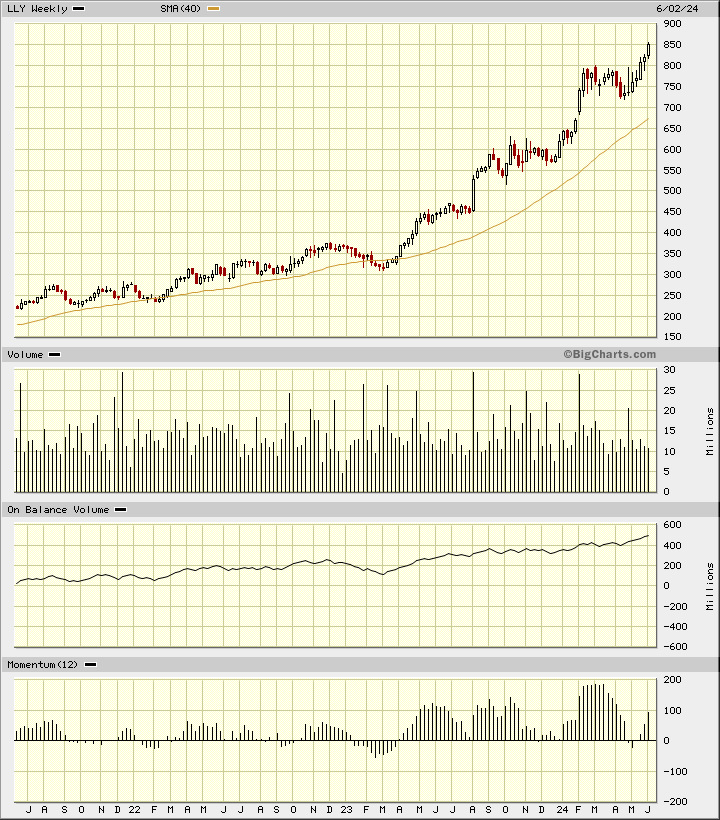
In the weekly Japanese candlestick chart of LLY, you can see the powerful rally of the last three years. Very impressive. Prices are firmly above the rising 40-week moving average line.
The weekly OBV line has been strong and bullish for a while now. The 12-week price momentum study shows us a high in early 2024 but a lower high in June for a bearish divergence. The candles are not showing me a top reversal pattern nor any upper shadows.
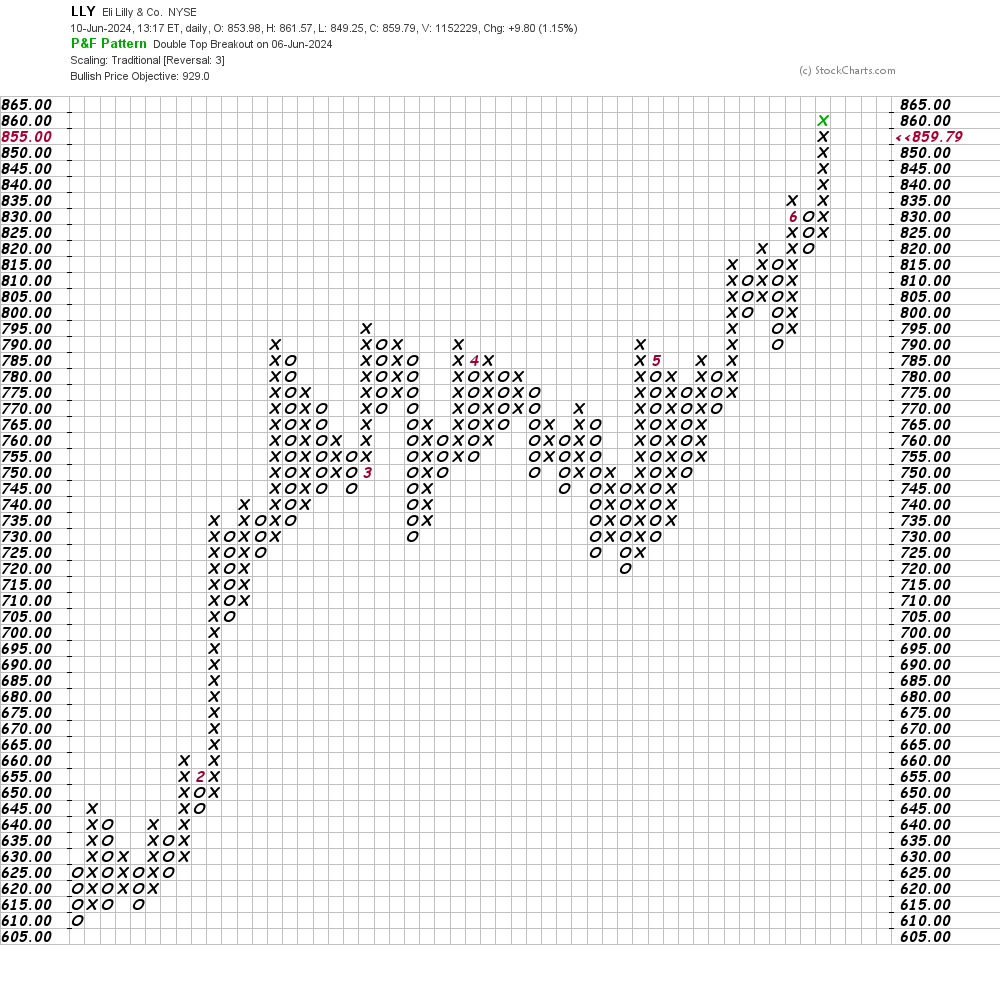
In this daily Point and Figure chart of LLY, below, I can see a potential upside price target in the $929 area.
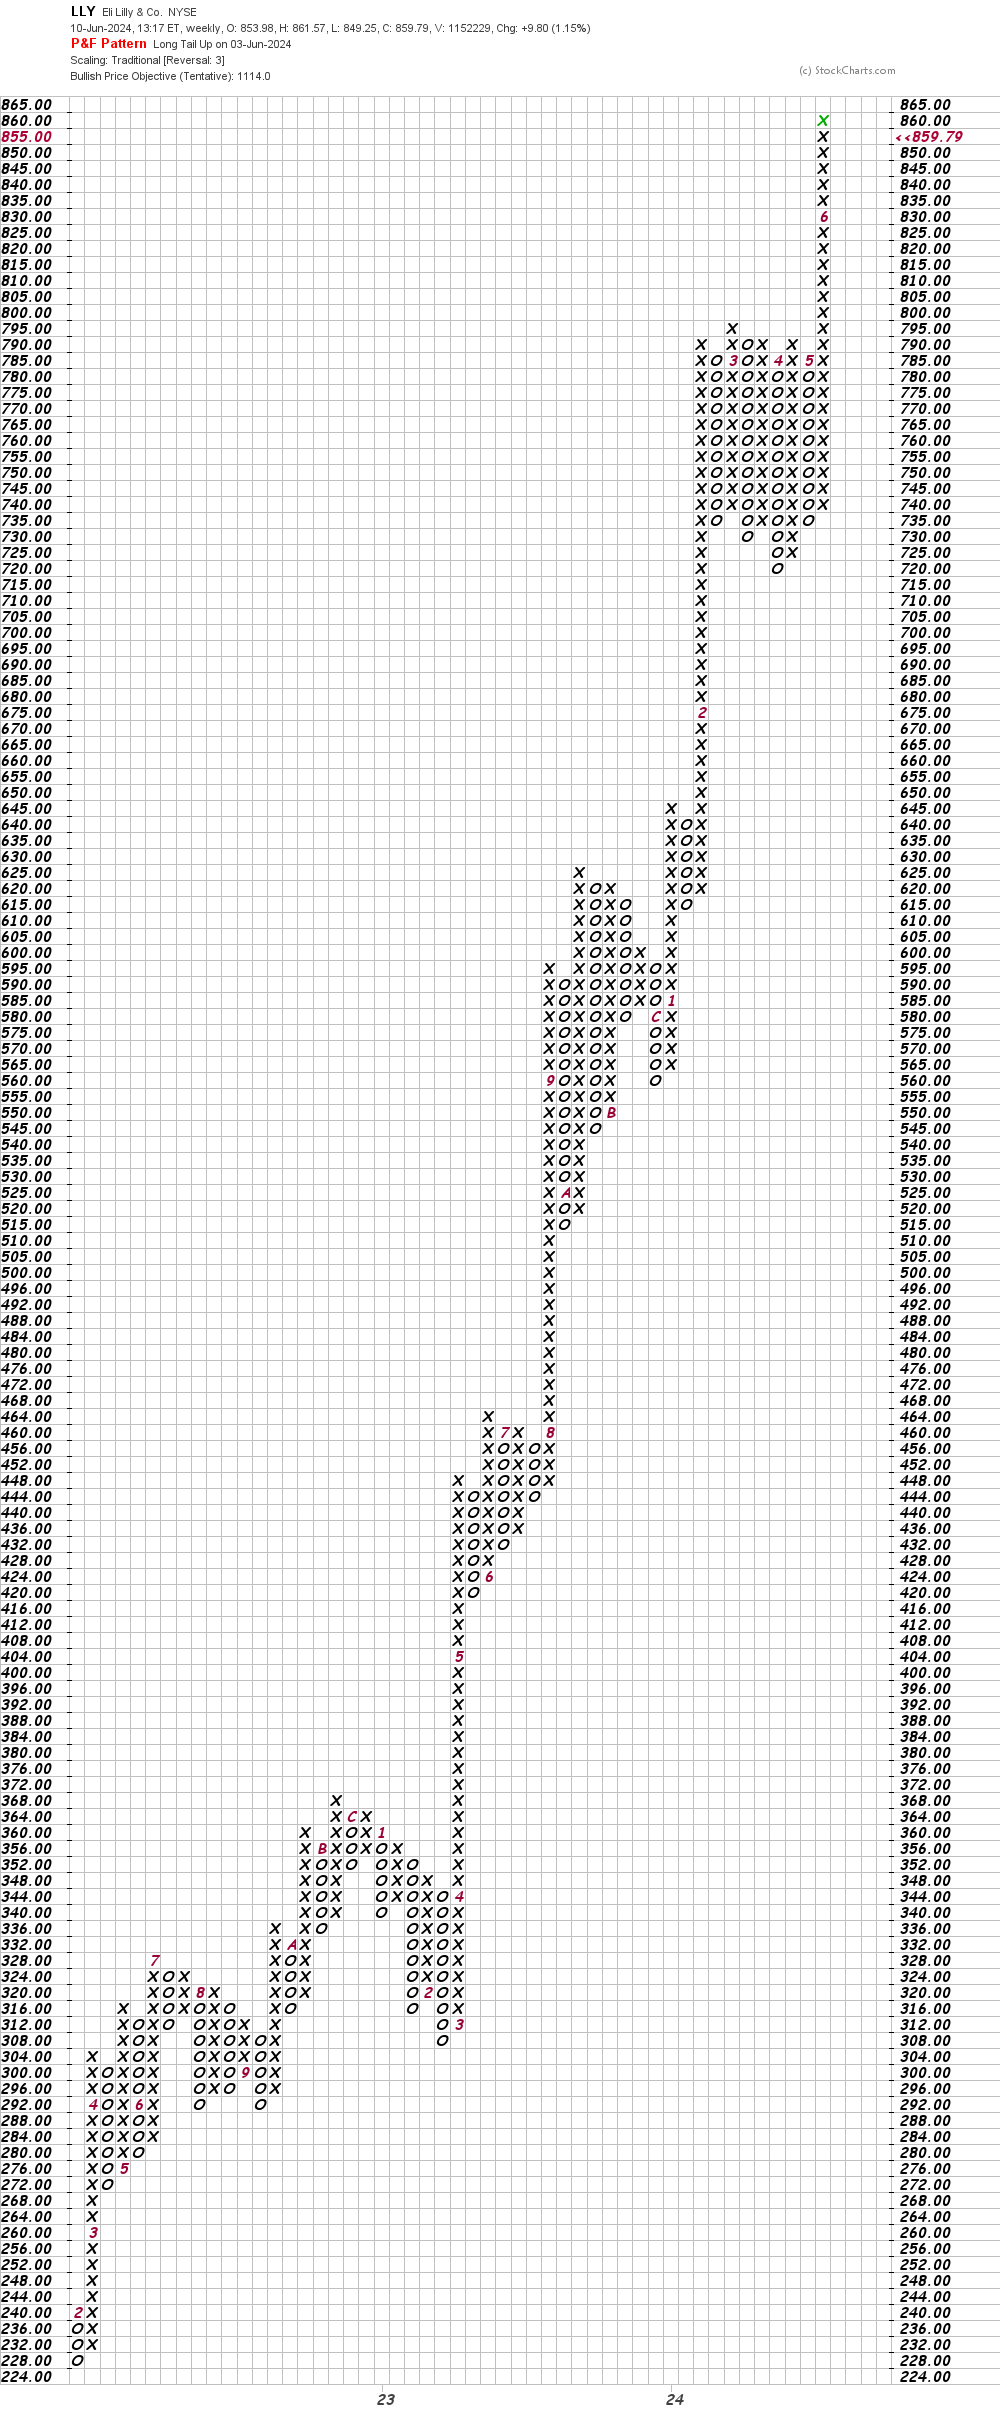
In this weekly Point and Figure chart of LLY, below, I can see that the software is projecting a price target in the $1,114 area.
Bottom-line strategy: The charts of LLY remain pointed higher. Raise stops on longs to at least $790.
Employees of TheStreet are prohibited from trading individual securities.