What Happens When the Oversold Rally Ends?
The indicators all show a decline in sentiment but are only a solid-day's breadth away from turning upwards again. What does it mean? Plus, QQQ, DELL, KLG, AMZN, XOM, MSFT, and TRV.
You've reached your free article limit
You've read 0 of 1 free Pro articles.
The Market
Friday’s action did little to dissuade me from my recent thinking that once this oversold rally is over, we are likely to come back down. It also did little to dissuade me from thinking the mega-cap names would help lift the indexes.
After all, Friday saw the S&P rise by nearly 25 points but the Equal Weight S&P was flat, as was breadth, barely positive. But mostly, the indicators did not change much.
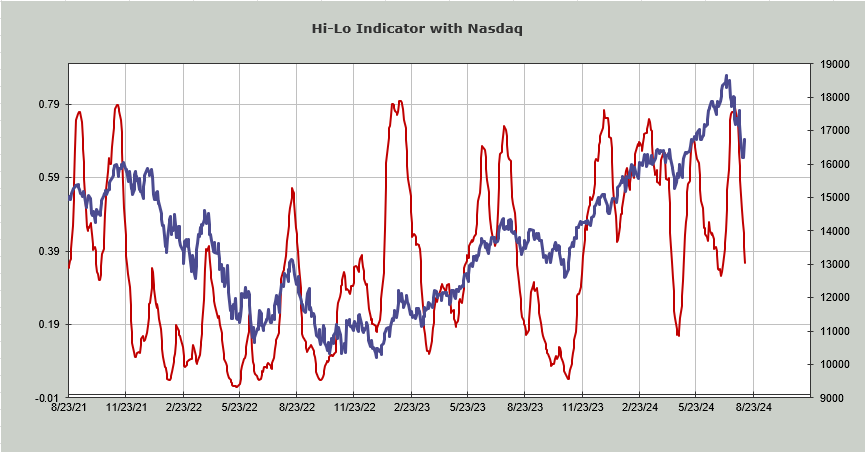
The McClellan Summation Index is still heading down but one decent day for breadth could halt the decline and might even turn it upward. The only other breadth indicator to note is the Nasdaq Hi-Lo is now at .36; under .20, and it gets intermediate-term oversold. The chart is shown below.
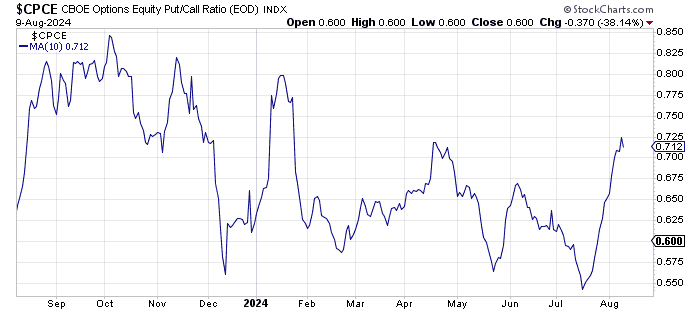
In terms of sentiment, I’m not quite sure it is done rising, but the ten-day moving average of the equity put/call ratio ticked down for the first time in nearly a month (mid-July) since it started rising so rapidly. The 30-day moving average is still very low (an intermediate-term indicator), but this shows the shift in sentiment (too bearish).
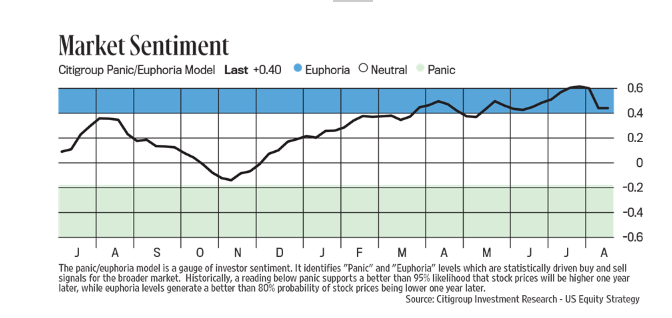
I can also report that the Citi Panic/Euphoria Model finally came off the boil. It is still quite high, but this is the first change we have seen. I think it will come out of the blue zone before this entire correction is over.
We have an awful lot of economic data out this coming week, which means we could gyrate quite a bit, but I think a pullback early this week, should we get one, would lead to one more rally
New Ideas
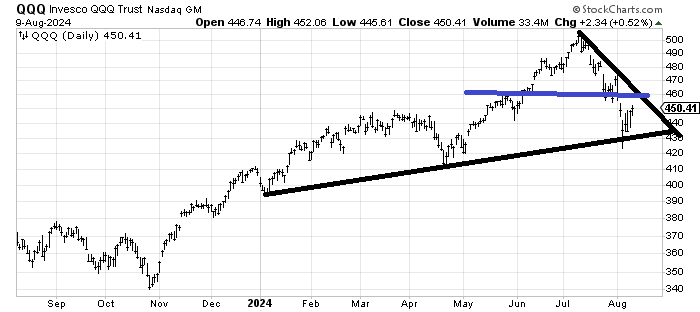
To follow up on the QQQs bounce from last week, my initial target was the low 450s and we got into that area Friday. I think that 460 area (blue) is going to be much more serious resistance.
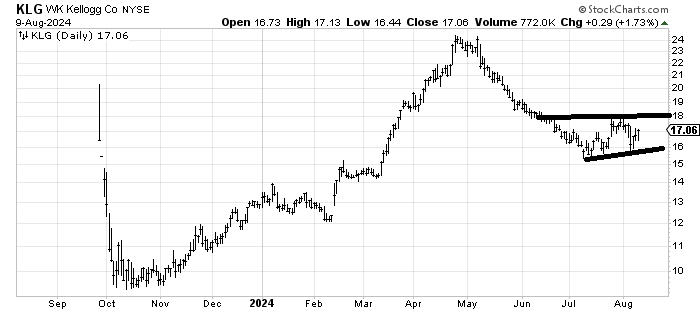
I am still waiting for WK Kellogg KLG to get through 18.
Today’s Indicator
The Hi-Lo Indicator is discussed above.
Q&A/Reader’s Feedback
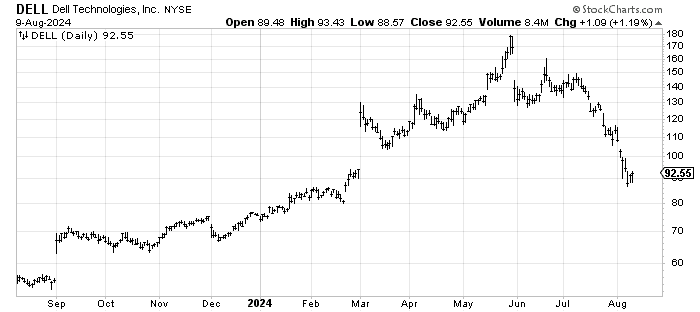
I was asked to follow up on Dell DELL, since it did not break that spike low from a few days ago. It ought to rally toward that gap in that 103-ish area but that spike low still matters and needs to hold. That’s your stop.
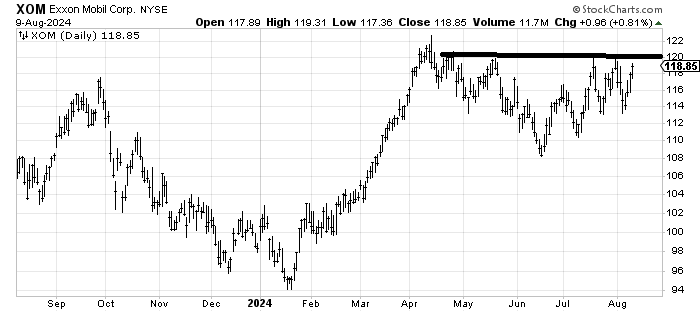
I didn’t love Exxon XOM when we looked at it a few weeks ago when it was at 120. But the fact that it did not break 114 on that trip down makes the chart much more interesting now. Through 120 and it still has that spike high at 123 to contend with but it seems more poised to break over 120 now than it did a few weeks ago.
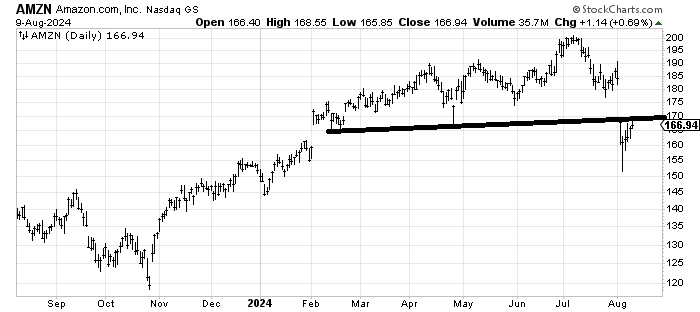
I don’t have a strong view on Amazon AMZN right now. It has decent resistance at 170, and if it manages to get over that, there is a gap to be filled –and I will call it 175-180. Yet if—when???!!—we come back down again that spike low near 150 ought to hold (see the discussion on spike lows last Wednesday evening). I suppose I’d say you can play for a rally, but failure to get over 170 is a yellow flag, and even if it gets over 170 I wouldn’t fall in love.
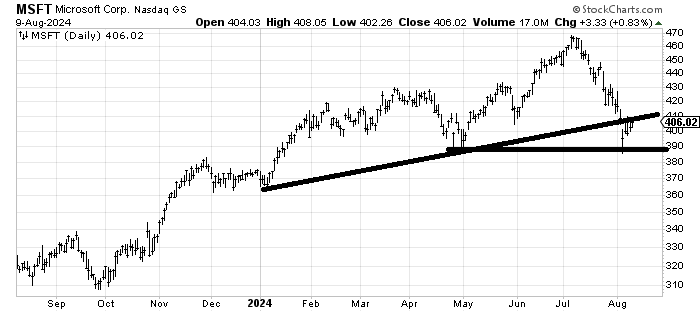
Microsoft MSFT is yet another stock with resistance overhead (410-ish) and I am not as certain about its recent spike low holding on another trip down. Please notice that last week’s spike low held at the prior spike low (spike lows tend to be contained on the first revisit to it. The second trip down is more of a toss up). For me, the risk/reward on this chart is a coin toss. If it rails here, it runs the risk of breaking last week’s low.
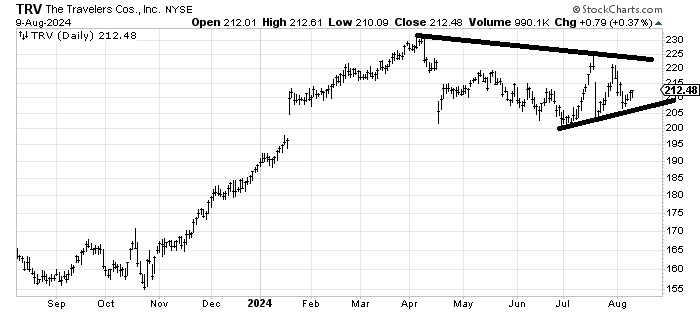
Travelers TRV is an interesting chart because it has been going sideways since April and has been making higher lows since early July. I’d say as long as it doesn’t break that 205 area it looks okay to me.