We Got the Selloff. So Where’s the Fear?
Let’s discuss why sentiment readings have me ‘on edge’, what it would take for an oversold bounce, a formerly parabolic stock and much more.
You've reached your free article limit
You've read 0 of 1 free Pro articles.
The Market
Well we got the selloff but does it feel panicky? Not yet it doesn’t.
How can it feel panicky when volume in the QQQs is 35 million shares? How can it feel panicky when breadth is still positive? How can it feel panicky when the SOX is still milling around that 12,000 level?
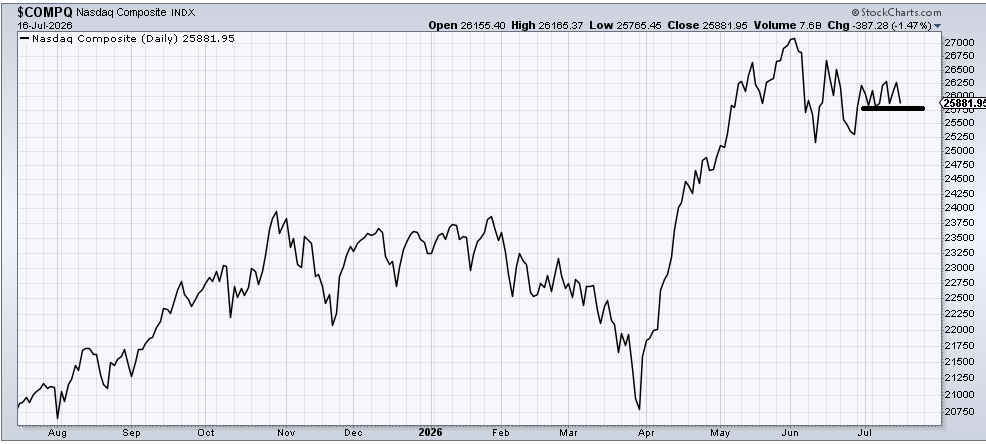
And recall the other day I went through an entire exercise about the closing price of the Nasdaq Composite citing that 25,800 level. Can you see it, right there? We have not been able to crack it in the month of July. Cracking it ought to give us at least a modicum of fear.
Speaking of fear, last night I noted the Investors Intelligence bull/bear ratio at 3.3. I was/am hopeful that we can see another rally next week that would get that reading up to that 4.0 area. But now we have another sentiment issue.
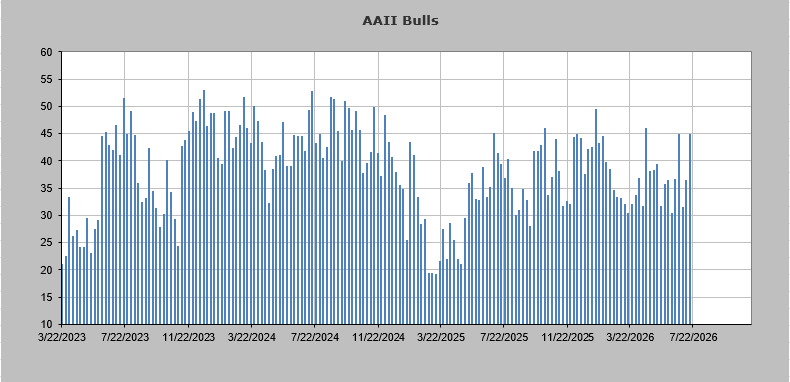
The AAII folks have gotten bullish. The bulls are at 45%, the highest since the low in late March, or at least it has matched the high. The bears are down to 33%, the lowest since January. I did not expect folks to get so bullish THIS week. Again, I wanted it next week.
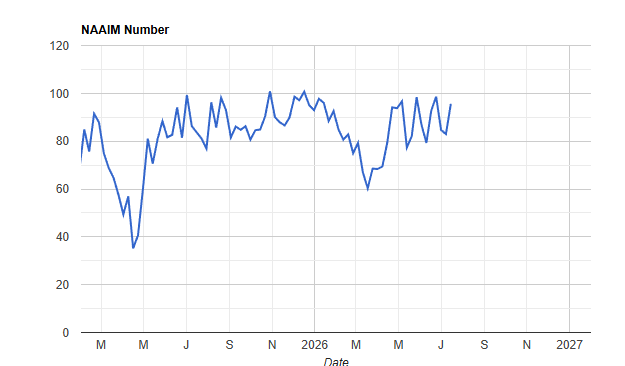
Then there are the NAAIM folks. They have lifted their exposure back up to the 95 level. Notice it has matched the pattern (generally) of the S&P 500 since May. This upper-90s area is what I call bordering on giddy.
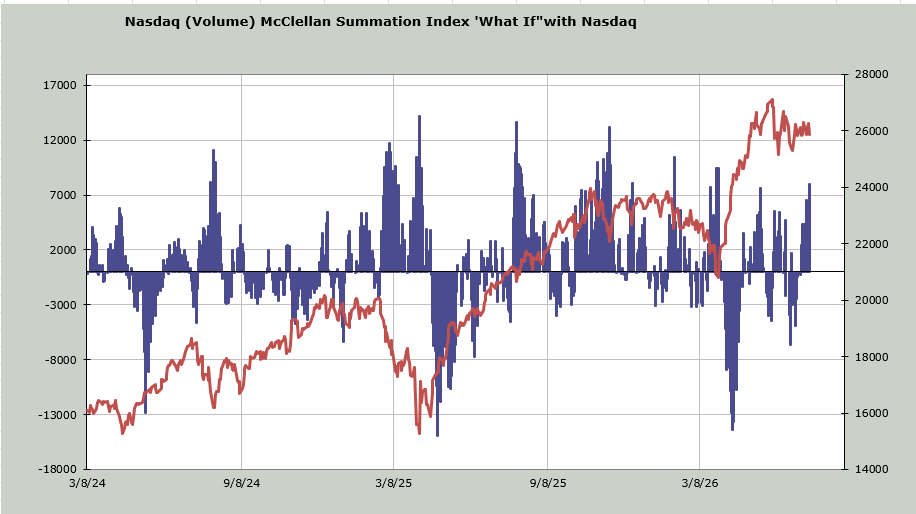
At least we got the “what if” for the Nasdaq McClellan Summation Index to +8.1 billion shares so that is now into oversold territory.
I still think if we can get some more downside, especially in the semis, in the next day or so, we will be due an oversold bounce there next week. But those sentiment readings have me on edge.
New Ideas
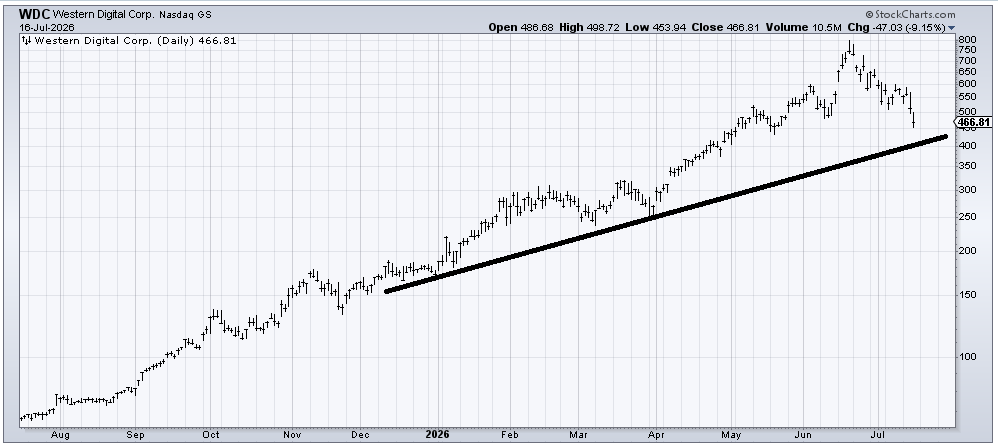
Exactly one month ago today I highlighted Western Digital (WDC) as a stock that had finally gone parabolic. I noted it was up 50% in a week, had been doing so on gaps, and had reversed on the day. Since then the stock is down 40%.
I then followed it up two weeks ago drawing in this line noting I thought it would eventually make its way here. Note that this line comes is pretty close to the May low. I would guess WDC gets a bounce off that line should it get there. But if it does get there it will make (by a smidge) a lower low, which is not bullish. So we’d talking about a short-term trade.
Insert wdc here.
Today’s Indicator
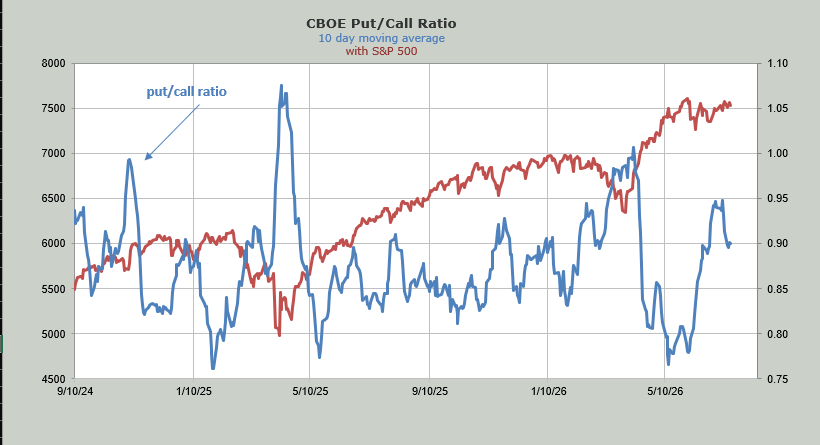
The 10-day moving average of the put/call ratio has come down enough to take the “bearishness” out of the indicator. Now it’s in the middle of nowhere.
Q&A/Reader’s Feedback
Helene welcomes your questions about Top Stocks and her charting strategy and techniques. Please send an email directly to Helene with your questions. However, please remember that TheStreet.com Top Stocks is not intended to provide personalized investment advice. Email Helene here.
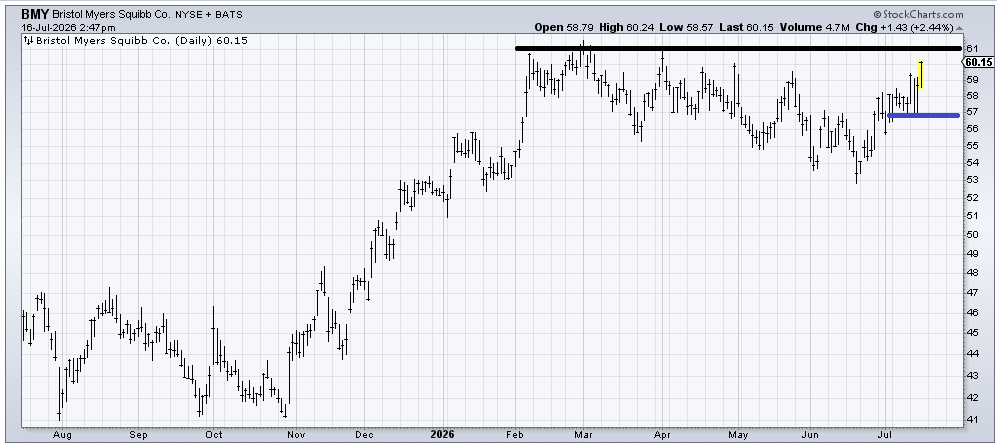
I seem to always be a sucker for the chart of Bristol-Myers Squibb (BMY) and with the exception of that run from November through January I haven’t made much money in the trade. Earnings are out in about 10 days but for the time being I’m sticking with it, but will use a stop under that $57 area (blue line).
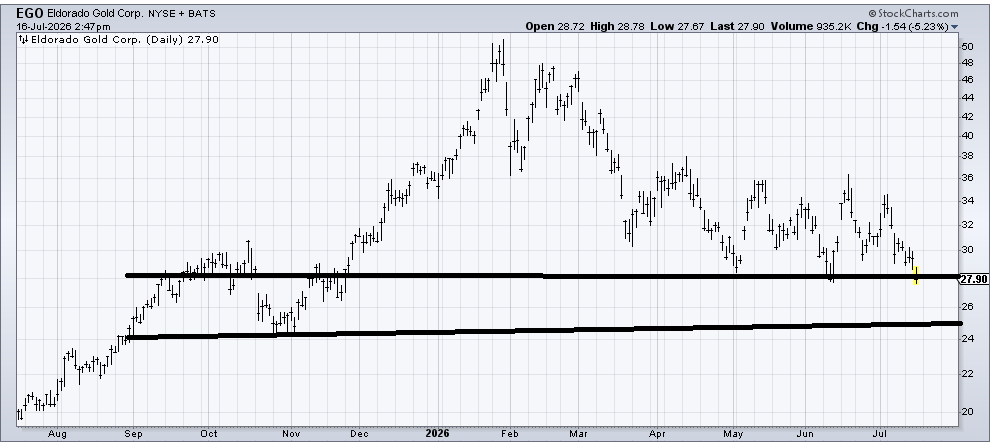
Eldorado Gold (EGO) should get oversold in the $25-27 area. I’m still watching that $360 area on GLD for a bounce (that has yet to materialize).
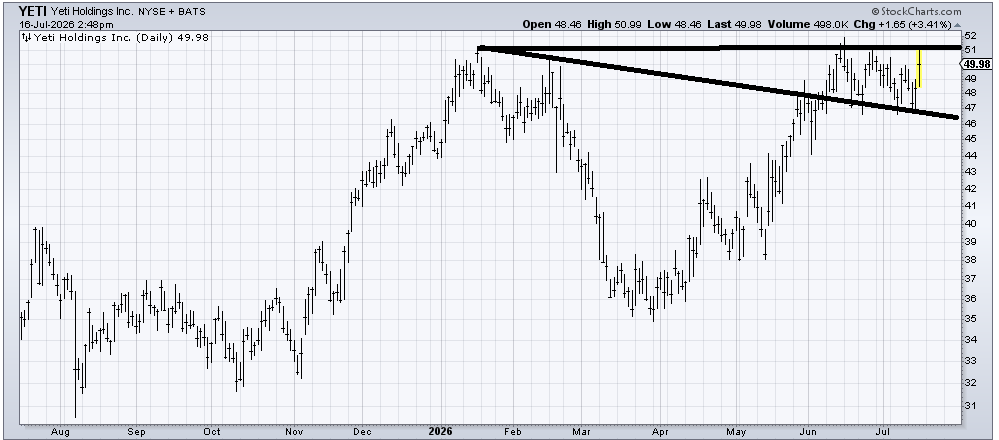
Yeti (YETI) has a decent chart and I’m sure I should like it, especially if it breaks out over $51. I have a hard time trusting it, and I’m not very good at breakouts that are so high up on the page. I’d use a stop under $47.
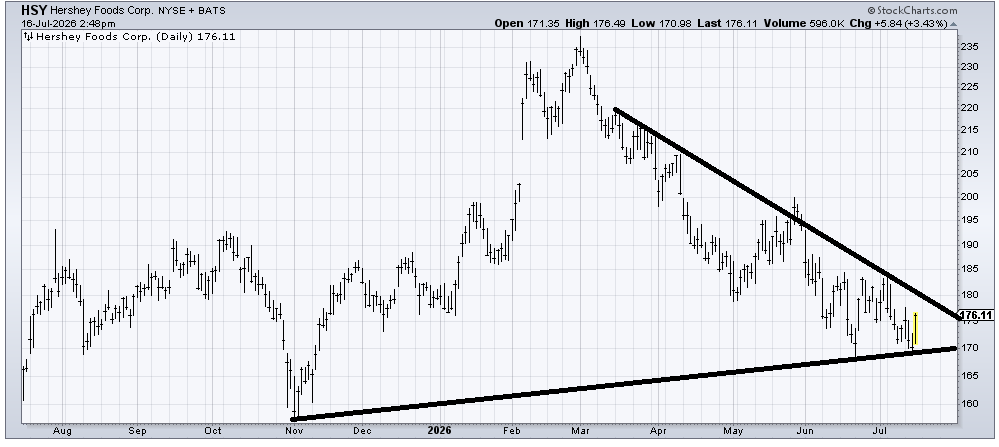
Could Hershey (HSY) be bottoming? I’m going to give it a chance as long as it doesn’t break under $170. But there is no base to speak of so if the stock is bottoming, it’s got a lot of work to do. The risk/reward is decent, though.
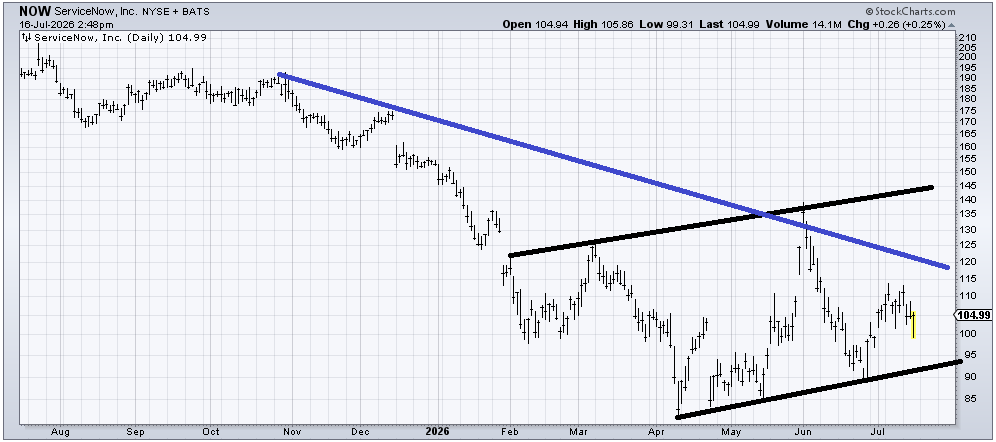
ServiceNow (NOW) has been trading between those lines since February so for the time being I expect that to continue. The longer it can do that the better the base it can build. The blue line is first resistance.
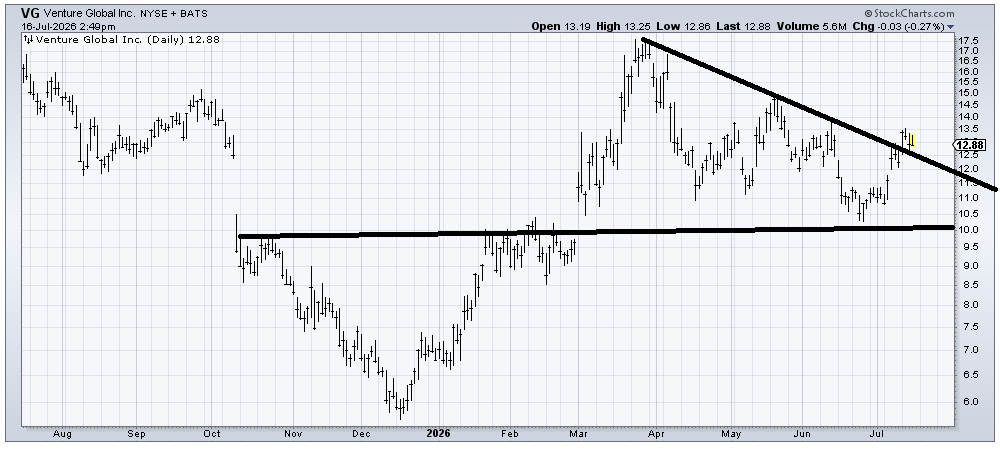
When I saw the ticker VG I immediately wondered if Vonage had come back to life! But alas it is Venture Global. It feels like it is a few months too soon for it to make a move. Holding over $12 would show me there is real strength there. Time going sideways would help the chart.
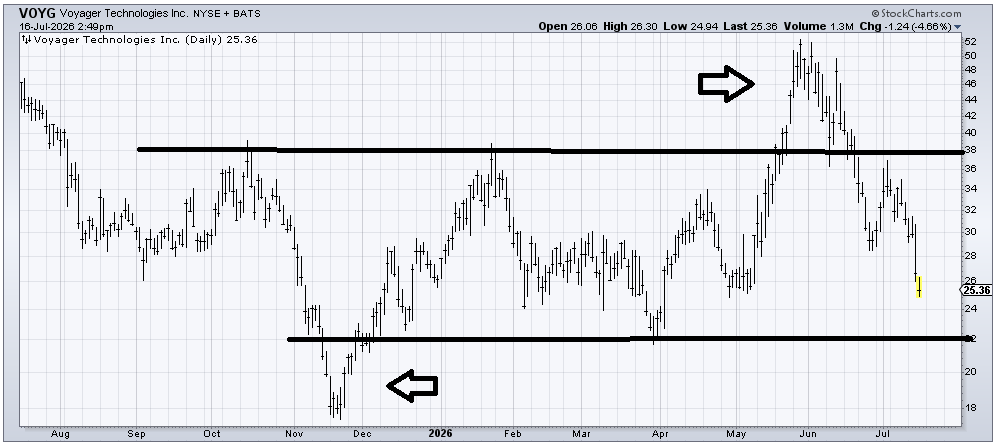
Voyager Technologies (VOYG) is not a pretty chart. But I suspect it gets short-term oversold in that $22-24 area and therefore ought to bounce from there. But that’s the best I can say about it right now. Notice that with the exception of last November and late May the stock has been in a trading range for about a year now.
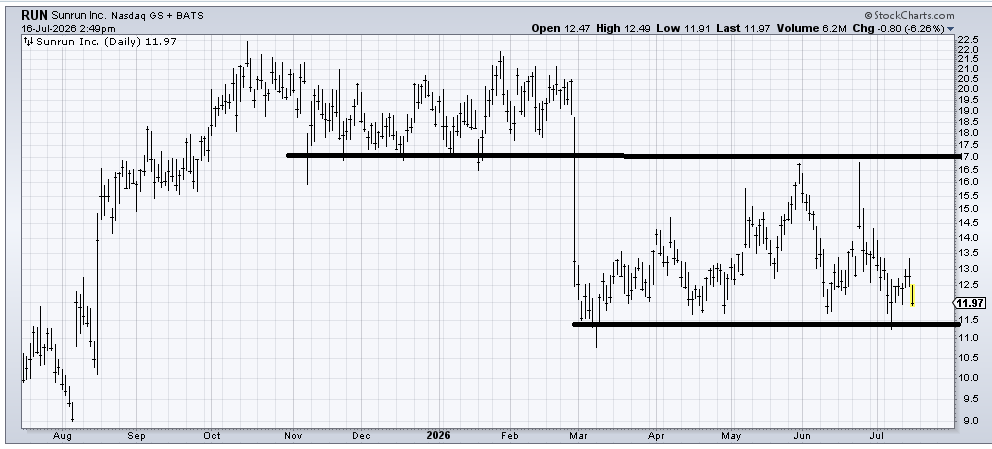
Sunrun (RUN) had better hold that $11 area. If it can’t then I think it fills that gap from last August (around $9).