Was It a Short-Term Back-Off for This Sector or Something More?
The utilities are a proxy for rates, which impact every aspect of the stock market. The question is, what's next for them? We'll also look at the midcaps, PG, the USD, ABT, and a big list of your stocks!
You've reached your free article limit
You've read 0 of 1 free Pro articles.
The Market
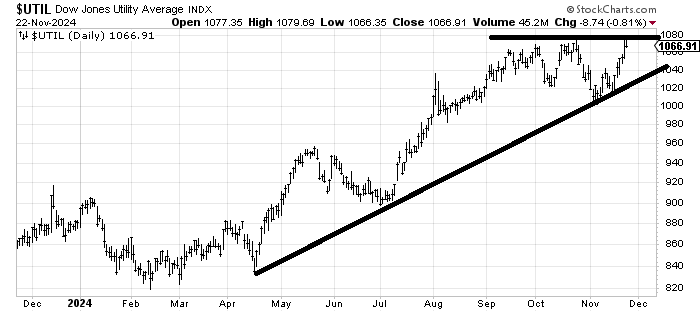
The S&P has been green for five straight days. That doesn’t happen often. Can it keep going? Sure but the more likely scenario is there will be a red day early this week. But what I really want to discuss is the chart of the Utes.
I like it when the Utes or bond proxy stocks rally because, typically, it means the market is either expecting lower rates or currently enjoying them. That’s why I keep highlighting them. But as I noted last week all those bond proxy stocks are rallying but the bonds are not.
As someone who thinks the bonds really should rally, I will admit this has me rethinking my view on bonds. I am going to pay closer attention because when something should rally (or pullback) and it doesn’t that’s a powerful message.
Which brings me back to the Utes. Notice that they got right to the resistance area, even eked out a new high, but retreated Friday.
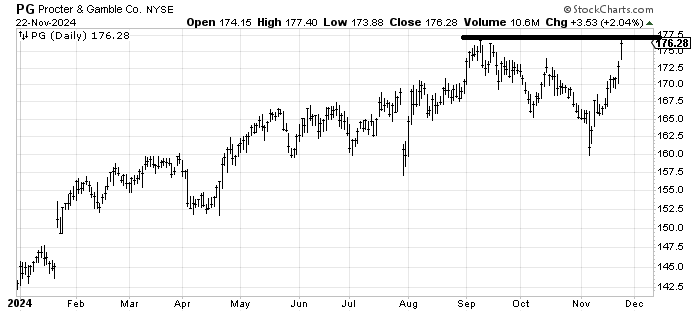
Now take a look at the chart of Proctor and Gamble, which I highlighted as a positive chart one week ago. It has rallied up to its old high. What if it can’t get through and retreats from here?
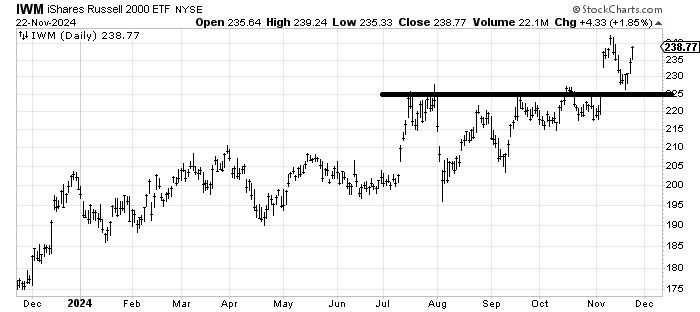
Or look at the IWM, which looks as though it came out of a textbook, gapping over prior highs, retreating to test the breakout (but not quite fill the gap), and is now heading up again. What you don’t want is it to do what it did in late July: rally, retreat, rally again, only to fail right back up at the high.
In other words, I’m focused on the Utes because we need to know if they are the leaders, and other charts are going to follow them back up to the highs but not manage to get through. I have an entire pile of charts that have this same pattern.
So let’s see if this was a one or two-day back-off for the Utes or something more.
Elsewhere not much changed in the indicators, although the McClellan Summation Index did tick up slightly.
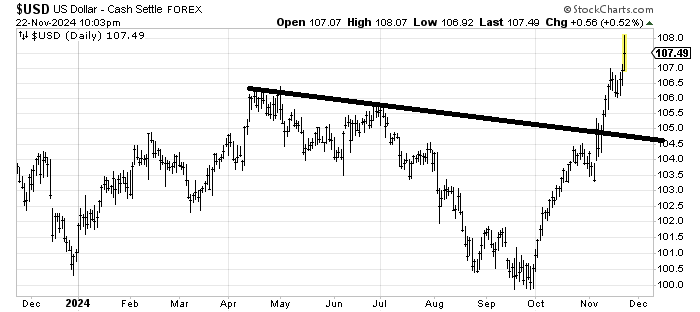
Lastly I was asked to address the US Dollar’s move. You might recall I was quite bullish on the buck in late September. And I questioned my bullishness right at the low, essentially giving up at exactly the wrong time. The move up is exactly why I was so bullish, because it had begun to feel like everyone was on one side of the boat and from the move up we can see they probably were.
But the question is, when does this move up end? And the other question is, won’t such a big move in the buck bother the multinationals?
The chart of the Dollar Index measures to around 110. It seems to me we have just started to hear Dollar chatter (when stock folks start chattering loudly about bonds, currencies, or commodities, it’s usually a sign we’re getting close to the end of a move). For example, I’m beginning to hear the question about multinationals (I don’t have that answer but in the past it has not been bullish for them). I am also beginning to hear calls for the Euro to get to 1.00 (currently it is 1.04). In September the calls were for the DXY to break 100.
The DSI for the Dollar Index is 86 so we’re close on that front. The DSI for the Euro is 10. So we should be on our toes for an end to the move in the buck, especially if we hear more chatter and the DSI’s slip to single digits for the Euro (and over 90 for the DXY)
New Ideas
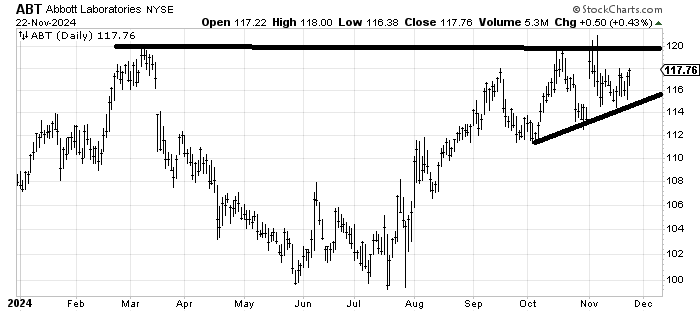
Abbott Labs ABT is a stock I have liked for a while but it has done very little in the last few months. Being a healthcare name that didn’t collapse when all the others did is also interesting (remember when it should do something and doesn’t it sends a loud message). I still like the stock but now I would use a stop under that 114 area.
Today’s Indicator
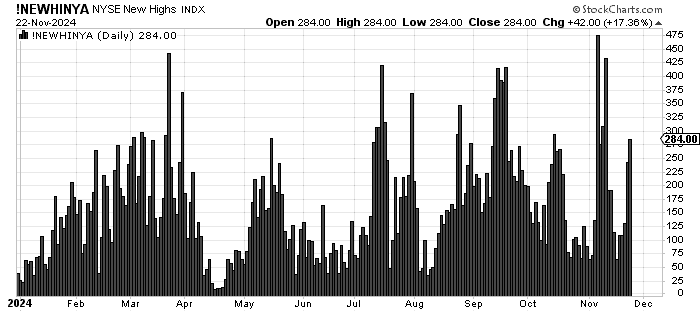
The new highs have expanded but are still well below the peak reading. They are essentially reflecting what we see in the charts.
Q&A/Reader’s Feedback
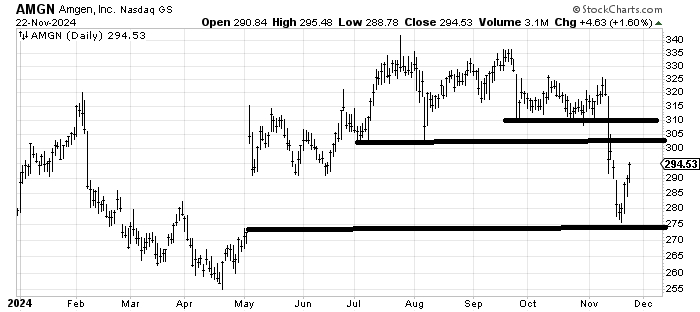
Amgen AMGN is a stock I liked in early November and then you can see it crashed and collapsed like all the other healthcare stocks (thus why ABT above is so interesting to me). It did fill the gap from May and now it has resistance in the 305-310 area. I think it struggles as it gets back to resistance. It will take a while to repair the damage.
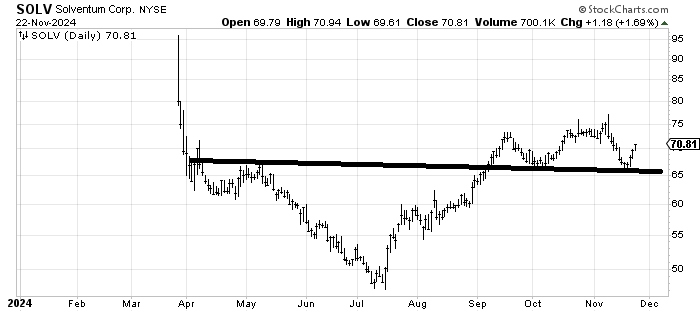
Solventum SOLV ought to be okay as long as it stays over 65 because there is a measured target around 80. However that spike high at 76 has to be watched (see the discussion above about getting to prior highs). As long as it stays over 65 I’d give it a chance.
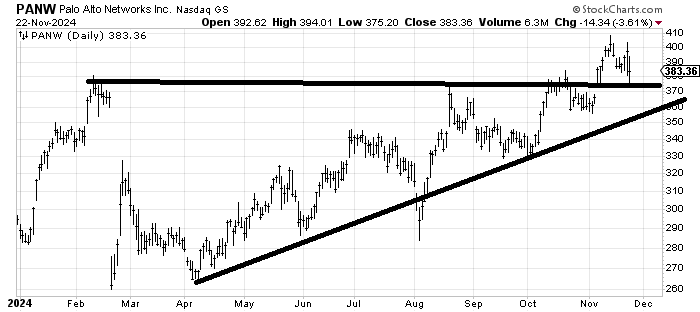
Palo Alto Networks PANW is a stock I have liked for a very long time (around April when it tested the February low). What I do not like is that move last week to test the high that couldn’t then surpass it (there is a theme here). I’d be inclined to take some profits if you have been in it for a while and I would not want to see it trade under 360-ish.
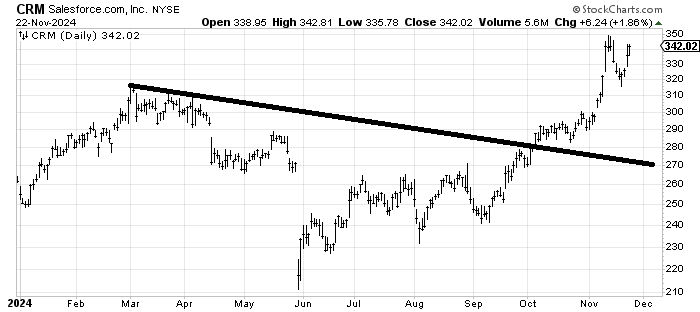
I had thought Salesforce.com CRM would come back to 270 before heading upward again (in October) but I was wrong because it never got there. It has a next measured target around 360 but here again, you can see that pattern of getting to the early November high is about to be tested. Earnings are out in early December.
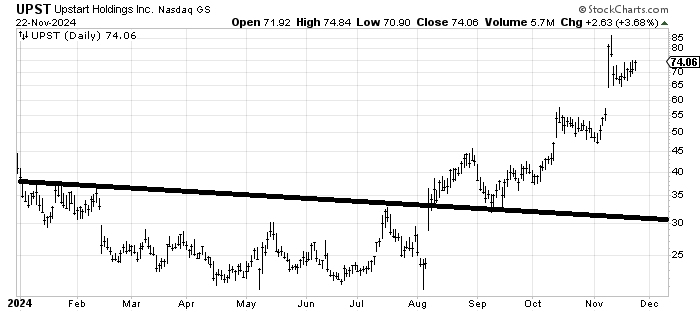
Upstart UPST has that same pattern with that spike high and is now attempting to test it again. It is not my kind of chart since there is no support close by the speak of. It did meet its measured target of 80-85 so I’m not a buyer but I would get concerned if it broke 65 or gapped down under 65 leaving an island above.
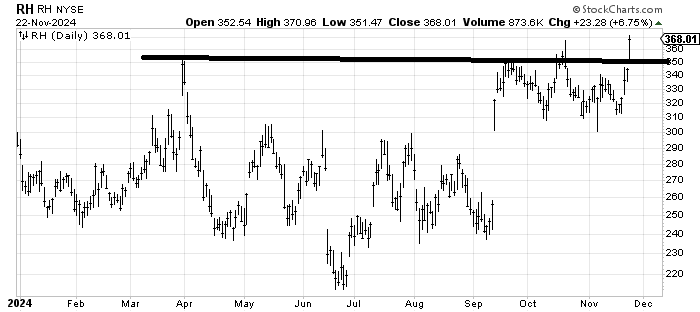
RH RH is another chart with a return to the highs. There is an unfulfilled next target around 380-390 but I’d get concerned if the stock broke back under 350. Also keep in mind that most retailers tend to peak within a few weeks of Thanksgiving.
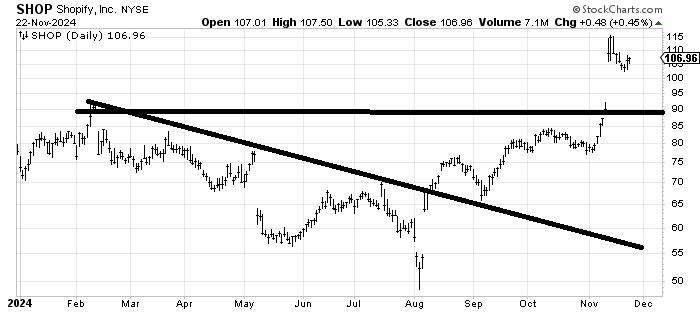
For the longest time every time we looked at Shopify SHOP I kept waiting for it to fill that gap around 90. Now it has and then gapped up on earnings. And there is the pattern again: waiting for a retest of the highs. This is not my kind of chart but there is a measured target around 120. If it came back to 90 and retested the breakout I’d probably like it but up here, I don’t see much to do.
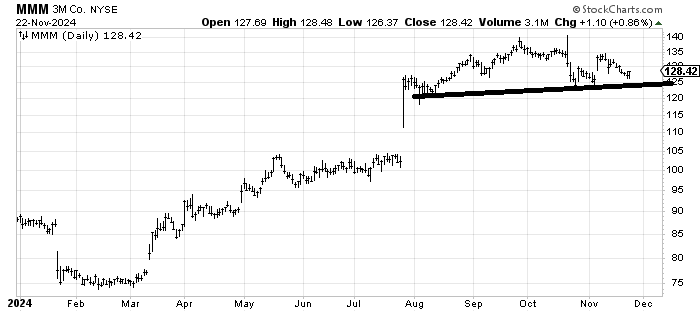
How is it possible that we have a different pattern in 3M MMM than all the others?! The stock has come down to fill the election gap so it ought to rally. I just don’t want to see it trade under 125-ish.