Up 5% in 5 Days, The Biggies Lead the Smalls
The S&P and NASDAQ rally, while the Russell doesn't. Sentiment can offer clues as to what's happening. Plus PHM, BIIB, SHOP, GILD, RUN, and MTCH.
You've reached your free article limit
You've read 0 of 1 free Pro articles.
The Market
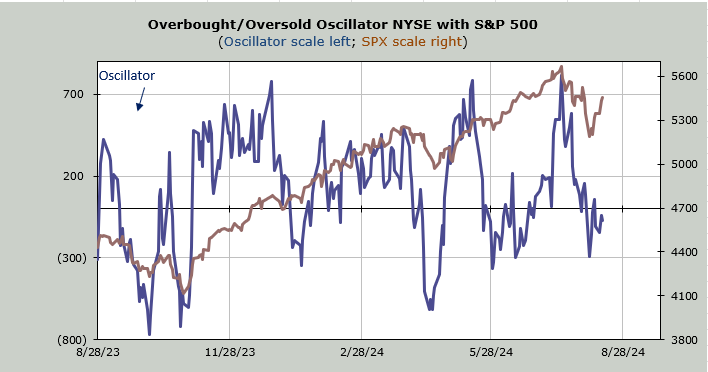
They tried to take the market down today and only succeeded in doing so for the small-caps. In fact, the S&P and Nasdaq are now up five straight days and up five and six percent, respectively, while the Russell has been flat for that time.
As you know, I said I thought the mega caps would lead the oversold rally and you can see it very clearly using the chart of my Overbought/Oversold Oscillator. It has barely budged in the entire week. Why? Because using breadth models, we were not that oversold. Maybe there will be a bit of catch-up in the 493 now.
However, if the market does not fall apart in the next few trading days, I expect we will see this indicator shoot right up into overbought territory.
Let’s move to sentiment. In the very near term, we are seeing the fear slip away. The put/call ratio was .89 today. That is not low in any sense but it is the lowest reading since July 22nd. That’s how we can tell folks are more comfortable with the market after five up days.
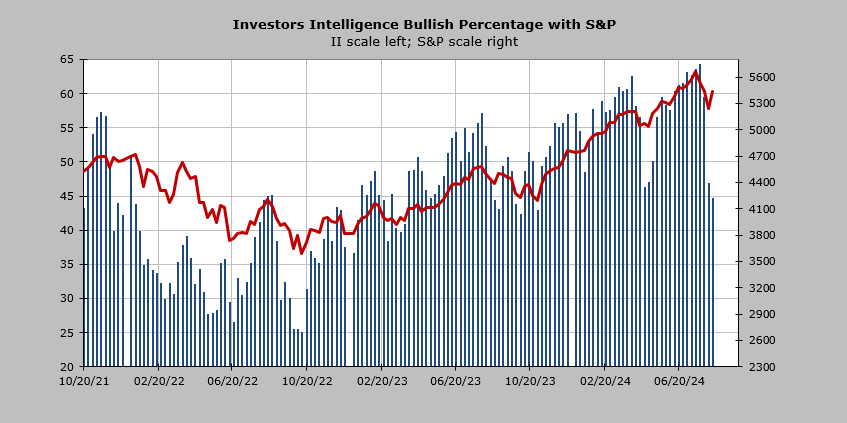
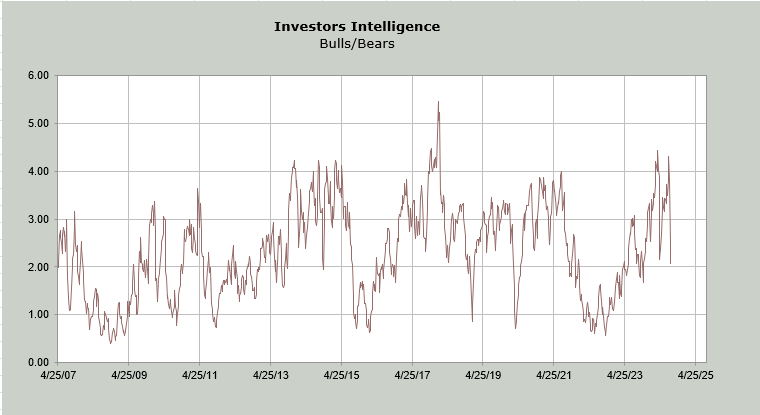
But on an intermediate-term basis, the Investors Intelligence Bulls are now at 44%, which is even lower than in April and almost back to where they were in the fall of last year.
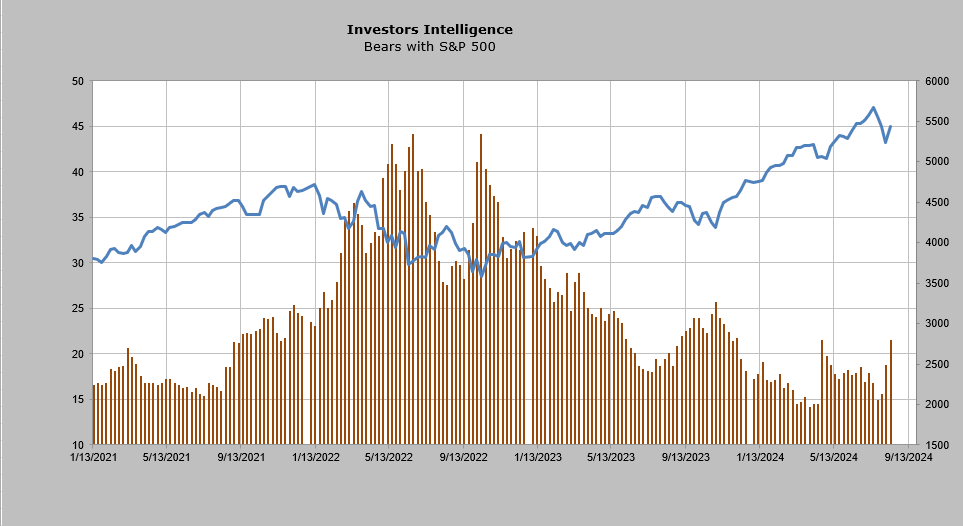
The bears are back to where they were in April and still quite a bit away from last fall’s reading.
The Bull/Bear Ratio is a smidge lower than it was in April. So I think I would sum it up that on an intermediate term basis, using this survey, sentiment leans too bearish. I am hopeful that we get a pullback in the market next week which ought to get these a little more extreme.
New Ideas
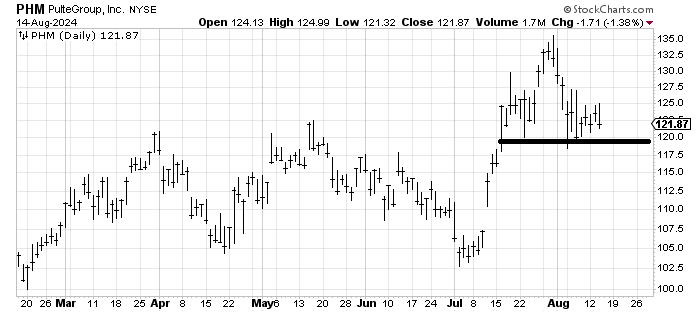
There has been much discussion lately over whether or not we are going into a recession. That is not my area of expertise but I will say that one stock to watch is Pulte PHM, a home builder. Since rates started falling it has come down, not up. That is a change in character for this stock. A break of 120 would confirm that this trip down from the highs is more than just a correction off the high.
Today’s Indicator
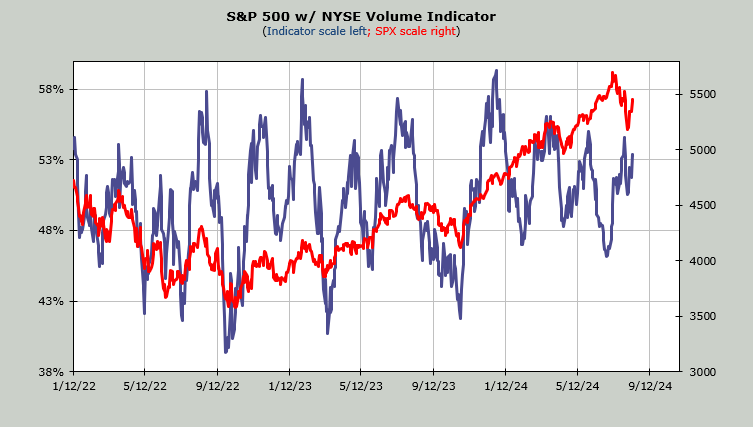
The Volume Indicator is at 53% which is far from oversold (oversold is 47% or under). This is another intermediate term indicator that is still overbought. If we get that pullback next week we ought to see this come down.
Q&A/Reader’s Feedback
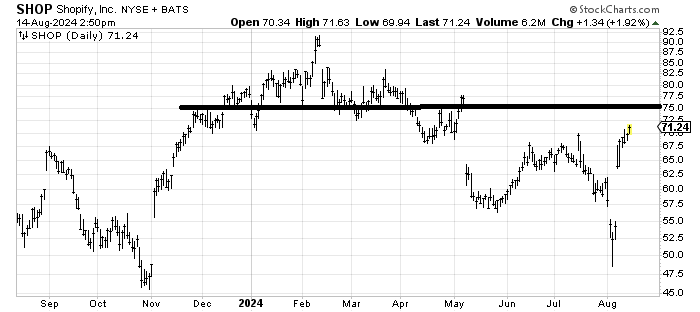
Shopify SHOP met its downside target of 50 in early August. Then it left an island below (bullish). But now that the stock is up almost 30% I can’t chase it. I also think it runs into resistance around 75-ish.
You have no idea how much I want to like Biogen BIIB every time it goes sideways and starts looking like it’s ready to rally. I have shied away from it because of exactly what we see in late July (gap down); it seems to do that more often than not. Unless it can rally back up over 210 (because then it would at least show a sign of getting through some resistance) I’d stay away. If you want to take a stab at it, I’d try it somewhere closer to 195 because that would at least fill that gap from Aprill.
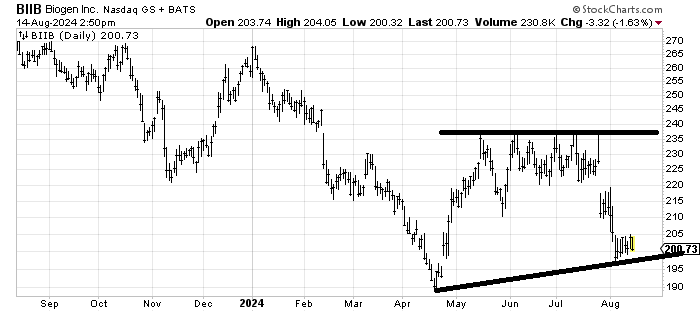
If Gilead GILD can trade around this 70-74 area for a few more weeks I would think it is a good spot to buy some. If it can then rally and get through 78 I’d think we’re looking at a gap fill near 84.
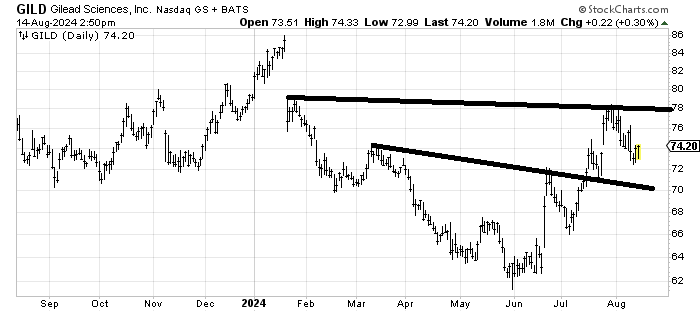
Sunrun RUN hasn’t done anything wrong yet but that resistance at 21 is formidable enough for me to wonder if it gets through it. There is also a measured target there.
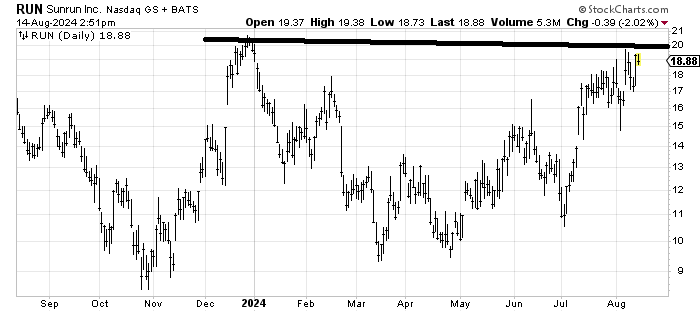
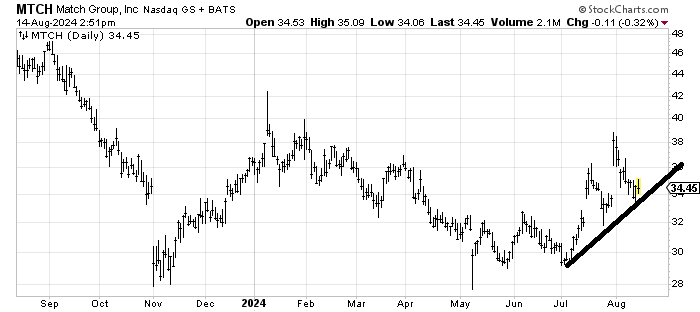
Match MTCH has some activists involved so in that respect it is a coin toss. The chart does look like it’s trying to base though. I’d say it’s buyable but use a tight stop under this recent low near 33.