This Utility Lays on the Charm With Its Yield and Attractive Upside Potential
Utility stocks have been gaining strength recently and Southern Co. is no exception.
You've reached your free article limit
You've read 0 of 1 free Pro articles.
The Southern Company SO is a widely known utility. The company pays a nice dividend but the charts are also looking fairly constructive.
Let's take a close look.
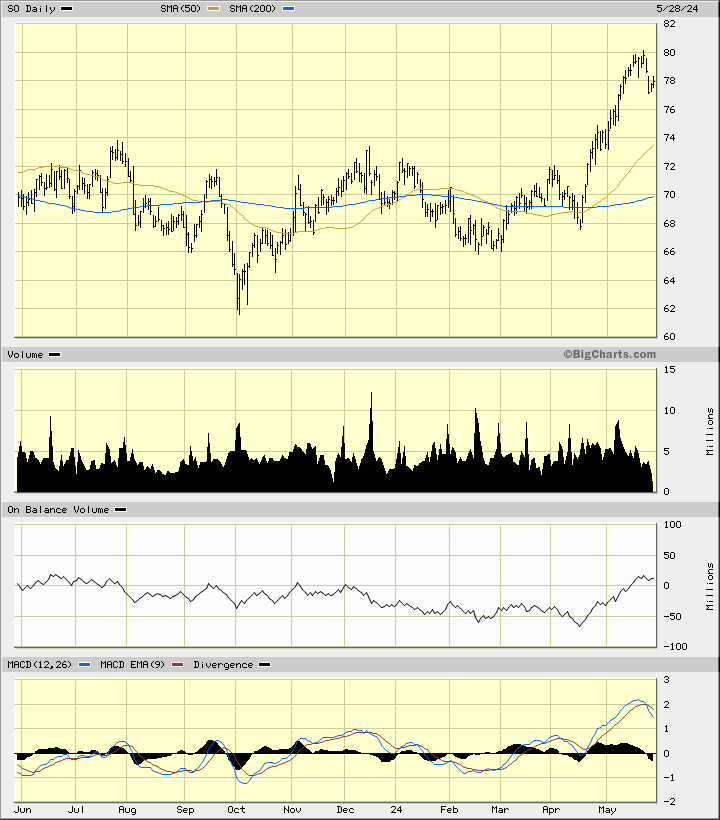
In the daily bar chart of SO, below, I can see that the shares largely moved sideways until late April when they broke out to the upside. SO now trades above the rising 50-day moving average line and above the rising 200-day moving average line.
The On-Balance-Volume (OBV) line turned upwards from the middle of April and tells me that traders shifted from being aggressive sellers to being aggressive buyers of SO. The Moving Average Convergence Divergence (MACD) oscillator is above the zero line but has crossed to the downside for a take profits sell signal.
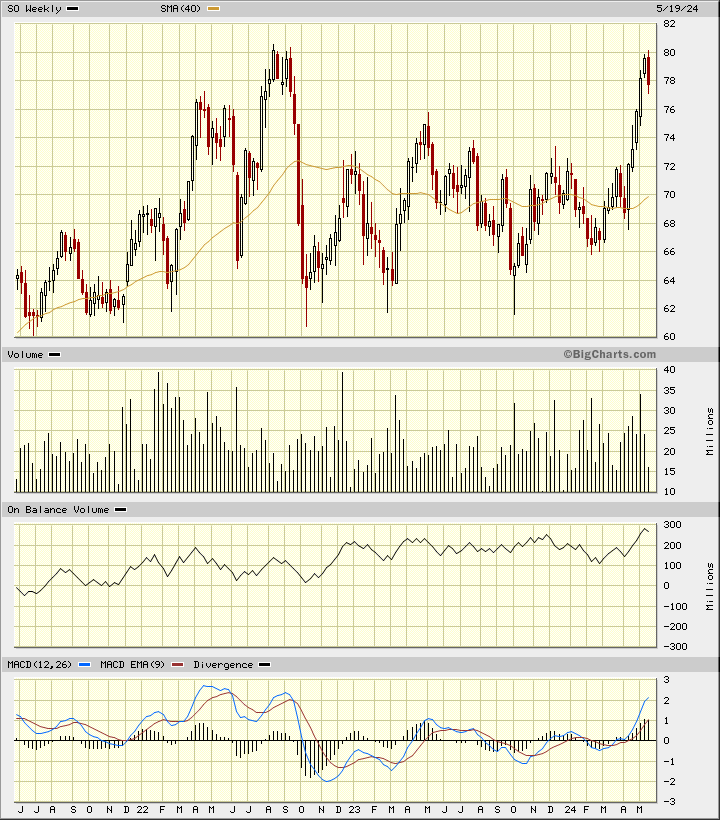
In this weekly Japanese candlestick chart of SO, below, I see a mixed picture. Prices have broken out to the upside but they have not (yet) broken the highs of 2022. The weekly trading volume has remained active.
The weekly OBV line is making its own upside breakout. The MACD oscillator is in a bullish alignment above the zero line. SO trades above the rising 40-week moving average line.
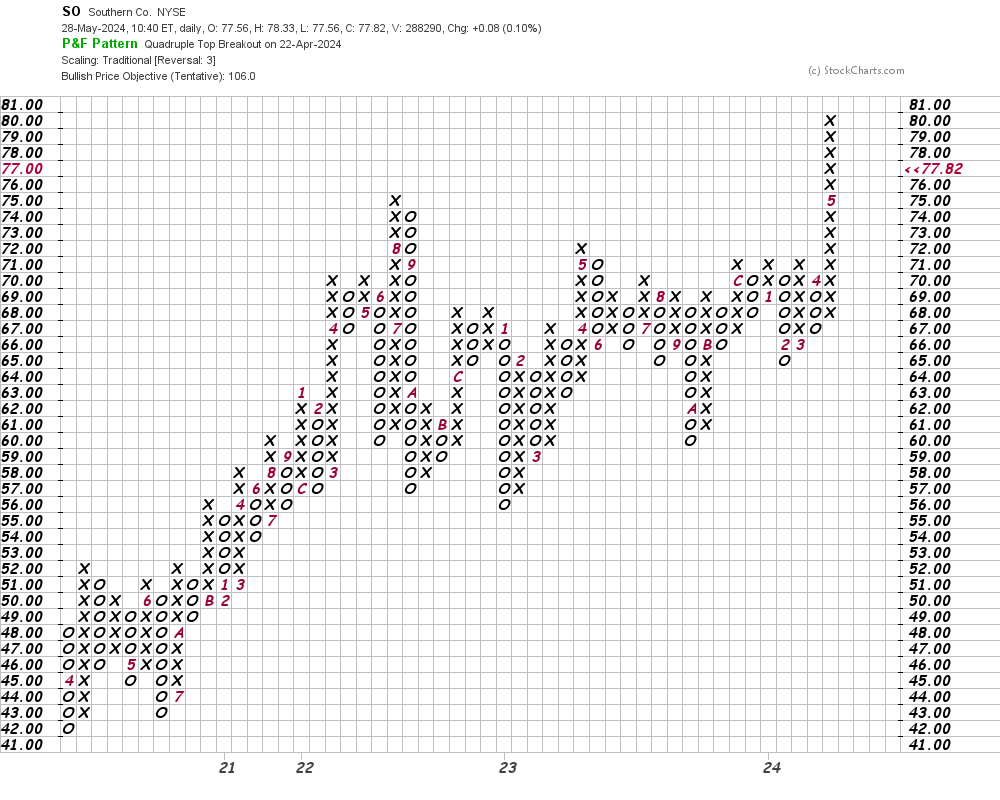
In this daily Point and Figure chart of SO, below, I can see the recent rally and a potential price target in the $106 area.
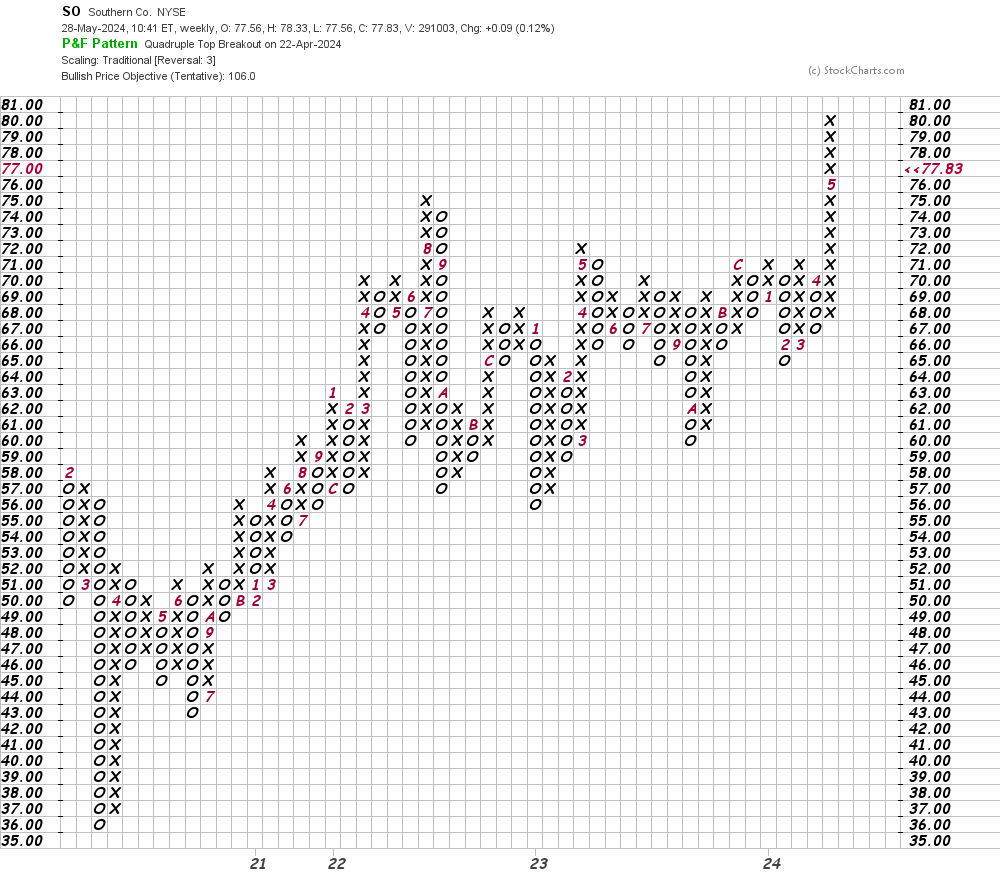
In this weekly Point and Figure chart of SO, below, I can see the same $106 price target as shown on the daily chart above.
Bottom-line strategy: Utility stocks have been gaining strength the past three to four months or so. Traders could go long SO at current levels risking to $73. The $106 area is my price target.
Employees of TheStreet are prohibited from trading individual securities.