This Low-Priced Infrastructure Play Could Rise 60%
Let's dig into the charts and indicators and formulate a strategy.
You've reached your free article limit
You've read 0 of 1 free Pro articles.
Cemex S.A.B. de C.V. ADR CX primarily sells Portland-Pozzolan blended cement and some other cement under various brand names. Cement is critical to building or in a broader sense infrastructure.
Let's check out the charts and indicators of CX.
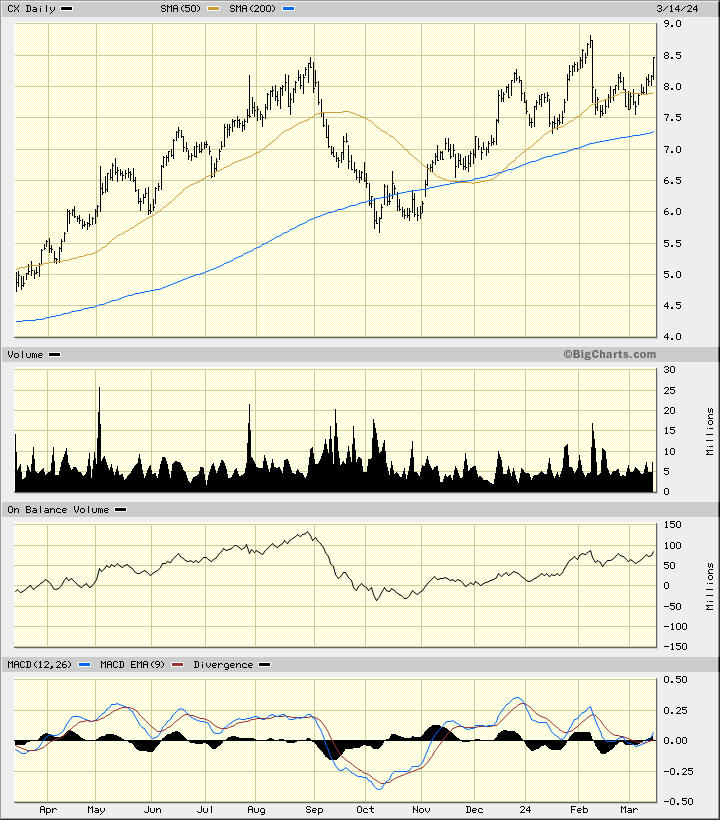
In this daily bar chart of CX, below, I can see a low in October followed by a renewed move higher. Prices have been trading around the rising 50-day moving average line and modestly above the rising 200-day moving average line.
The On-Balance-Volume (OBV) line has moved up from a low in October but is still below its best value reached in late August. The Moving Average Convergence Divergence (MACD) oscillator has been struggling to hold above the zero line.
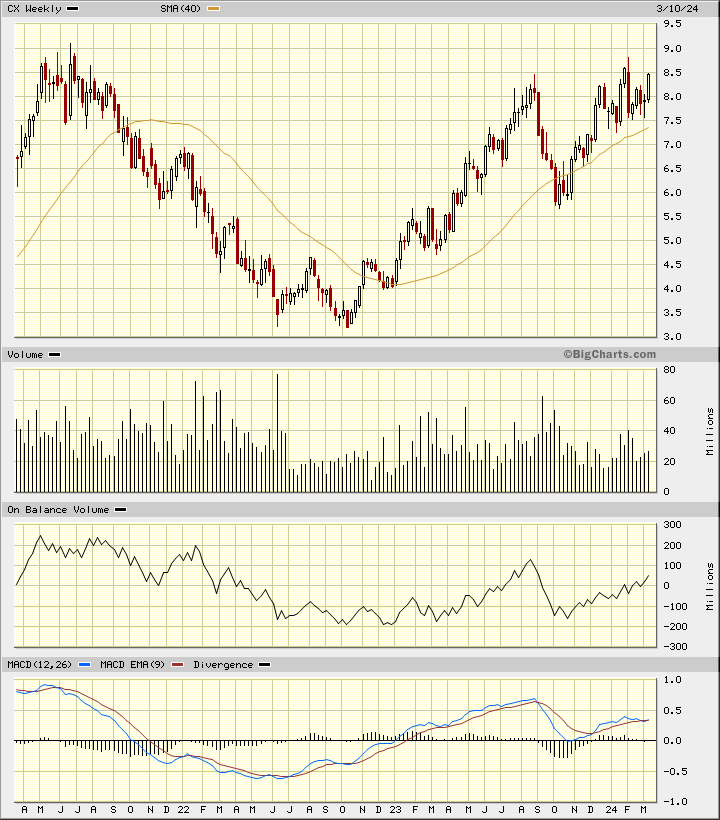
In this weekly Japanese candlestick chart of CX, below, I can see a "V" bottom in 2022. Back in 2022 CX could be considered close to a penny stock but prices have more than doubled in the past sixteen months or so. Prices trade above the rising 40-week moving average line.
The weekly OBV line has mirrored the price action. The MACD oscillator is above the zero line but the two moving averages that comprise this indicator are extremely close and this needs watching.
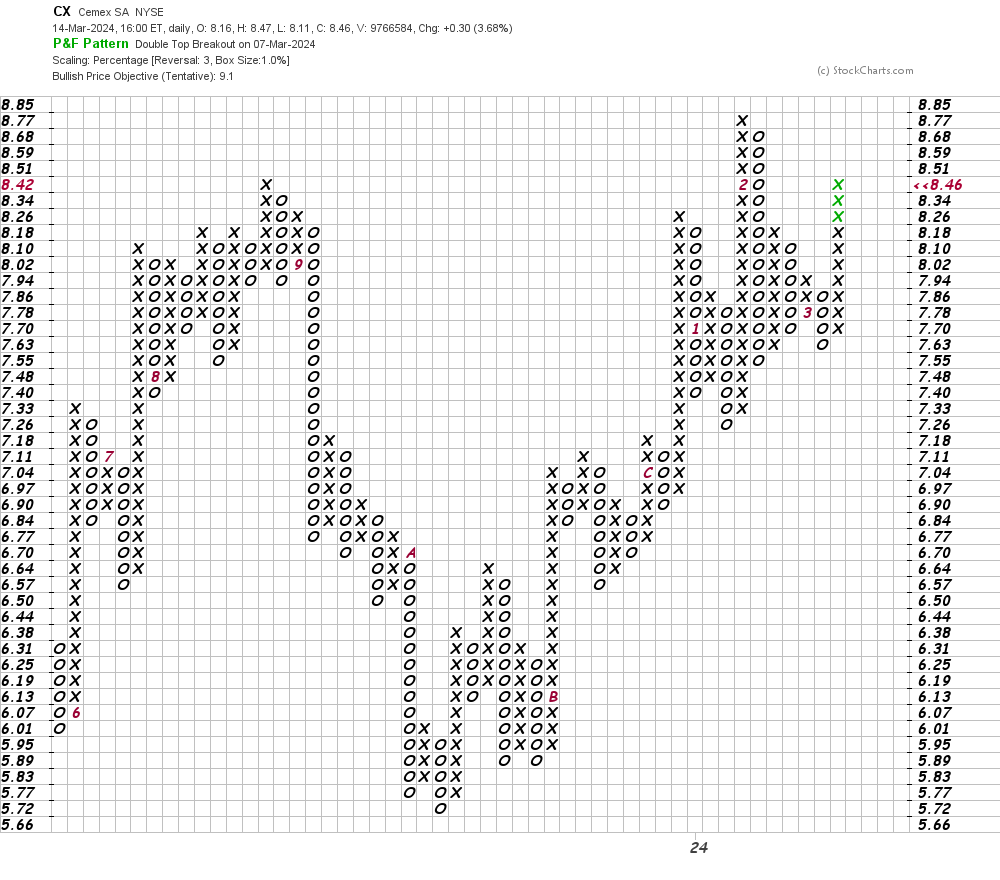
In this daily Point and Figure chart of CX, below, I can see an upside price target in the $9 area.
In this weekly Point and Figure chart of CX, below, I used a five box reversal filter and can see a price target in the $14 area.
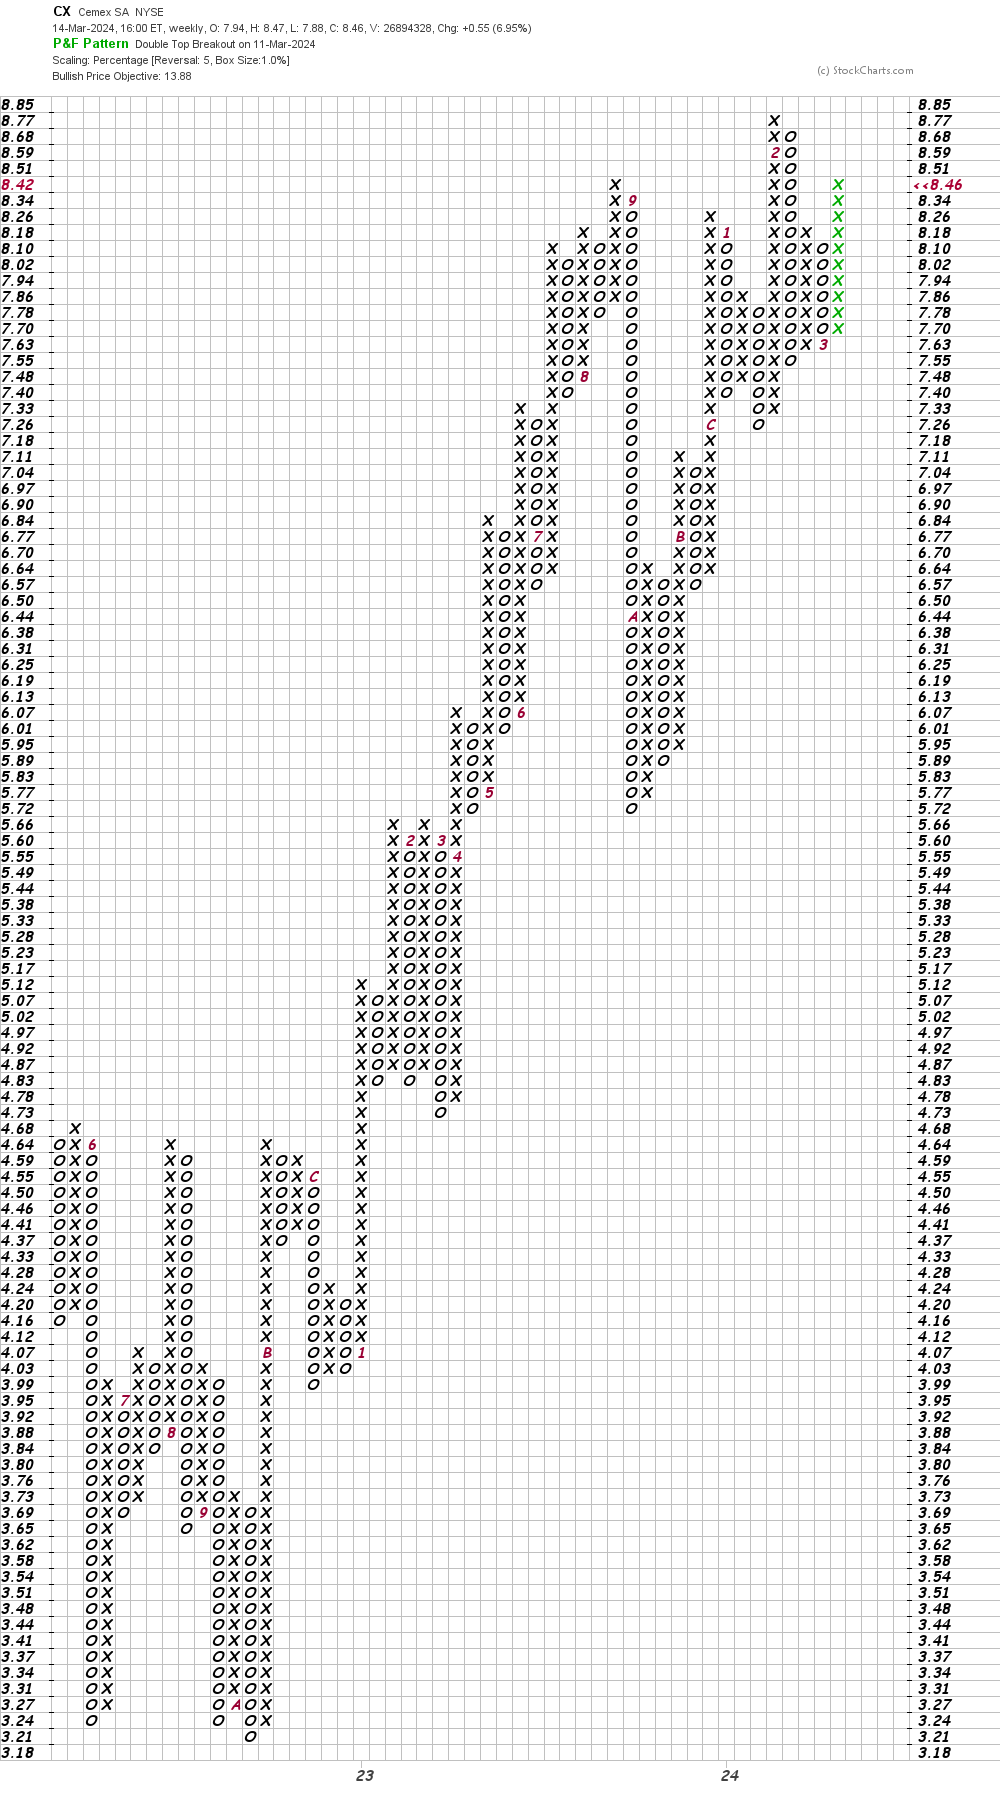
Bottom-line strategy: Traders could probe the long side of CX at current levels risking to $7.25. The $14 area is my price target.
Employees of TheStreet are prohibited from trading individual securities.