The Rally Was Fun, But Now It's Time to Buckle Up
The move up failed to change the indicators and I see more signs of a bumpy ride next week.
You've reached your free article limit
You've read 0 of 1 free Pro articles.
The Market
I’d love to tell you today’s rally changed the indicators, but it did not.
Breadth remains hardy, with no issues. The number of stocks making new highs didn’t contract as much as they had the previous two days, but they haven’t expanded, either. This is the overbought condition at work.
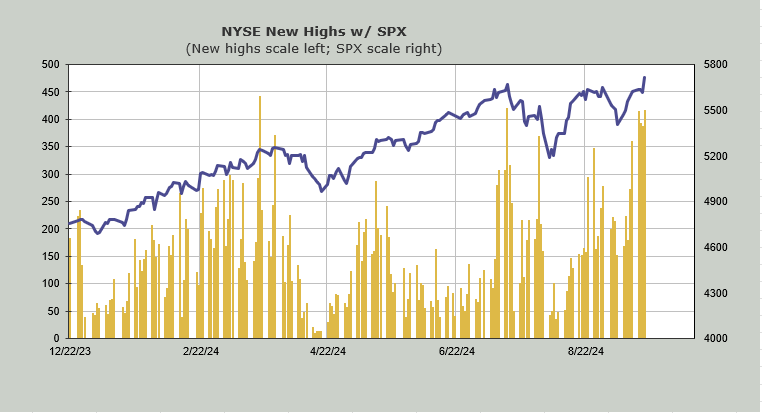
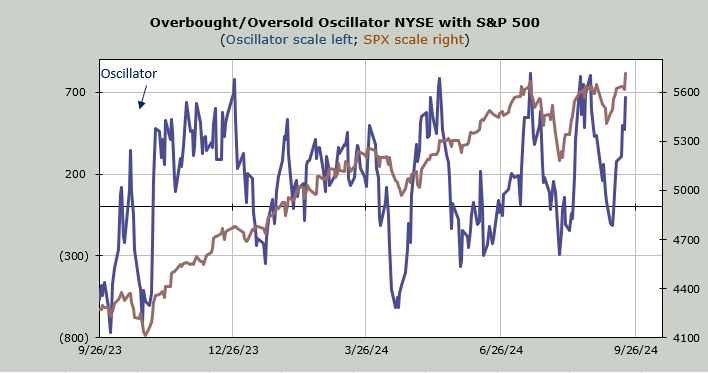
And today is the day the Nasdaq Momentum Indicator stops rising. Tomorrow is the day my Oscillator does. In fact, I would be shocked if my Oscillator is not up again tomorrow, regardless of what the market does. After that (next week) is when I expect it to head south.
Then there is the Volatility Index. Once again, it did not make a lower-low. Only now the Daily Sentiment Index for the VIX is at 16. If the market is up tomorrow, and we get the VIX down again, this indicator could slip under 15, which is what I consider the yellow zone. That would help my confidence in my call that we should get some volatility next week.
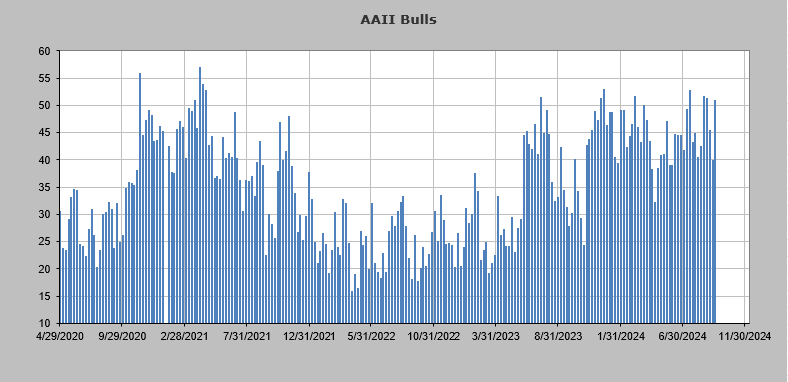
Away from that, the American Association of Individual Investor bulls jumped 11 points, to just over 50%. In the past few years, readings over 50% have led to corrections. Recall, we had such a reading as we headed into September, and we did indeed have a quick correction. I will, however, admit that the readings over 50% have not tended to come so close together.
The so-called recession stocks were red today and that is now three-straight days for the utilities on the downside, something that has not happened since June. It’s been a long time. The "Utes" might bounce tomorrow, since there is some support here, but I still think they are heading down.
New Ideas
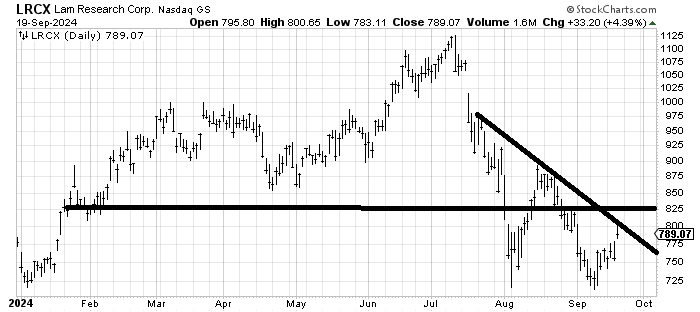
Lam Research LRCX finally got going, but like most stocks, closed poorly. But it did tag $800 and my target has been $800-$825 for this push up.
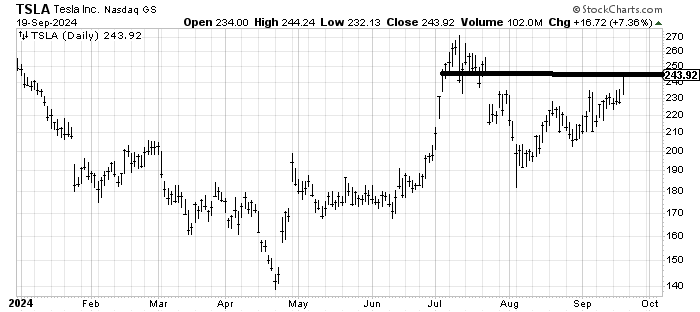
A week ago I recommended Tesla TSLA for a move to fill that gap and it could not get out of its own way until today. It did fill the gap today.
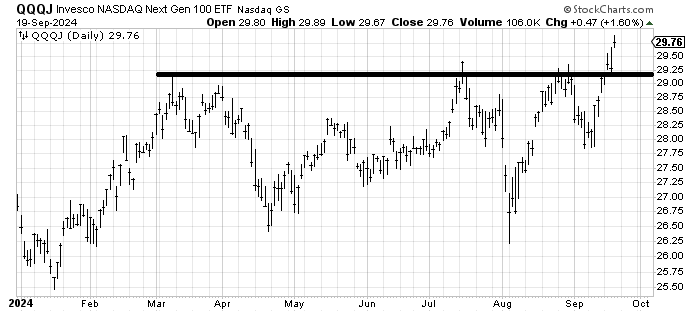
I have been talking positively about Next Gen 100 exchange-traded fund QQQJ (and the Expanded Tech-Software Sector ETF IGV), so I want to point out that QQQJ broke out today. It is quite volatile. If we can see a pullback to around $29 next week, I’d be a buyer again.
Today’s Indicator
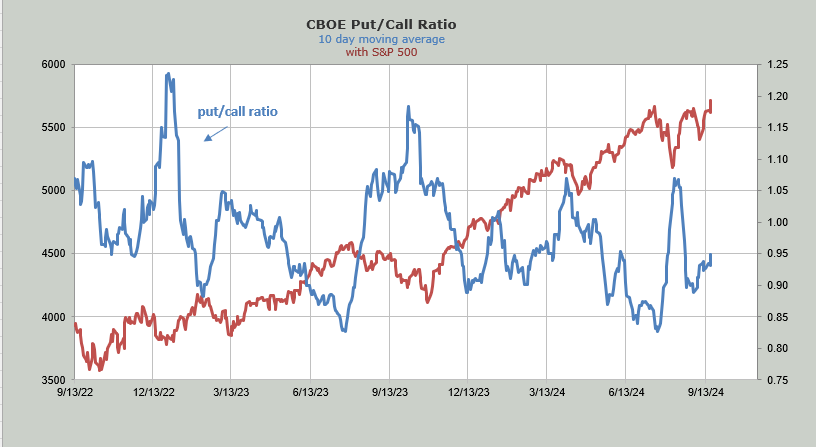
The 10-day moving average of the put/call ratio is still rising, which should help my cause for more volatility next week.
Q&A/Reader’s Feedback
Helene welcomes your questions about Top Stocks and her charting strategy and techniques. Please send an email directly to Helene with your questions. However, please remember that TheStreet.com Top Stocks is not intended to provide personalized investment advice. Email Helene here.
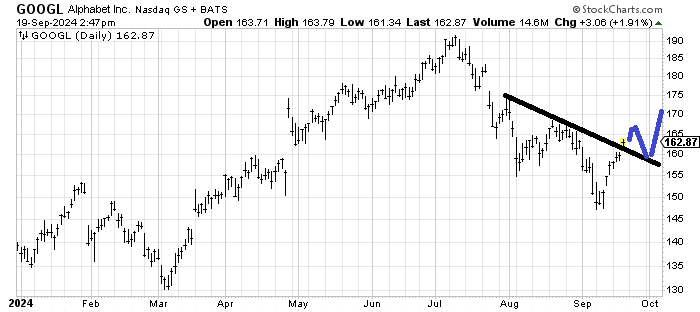
Will Google Find the Blue Line? You might recall I thought Alphabet GOOGL was buying on that mid-August trip down just under $160. It had a nice rally to $168 and then died. Now it is back to where I thought it was OK. It has crossed the short-term downtrend line, but is into resistance. I would love to see it map out as I have drawn in blue.
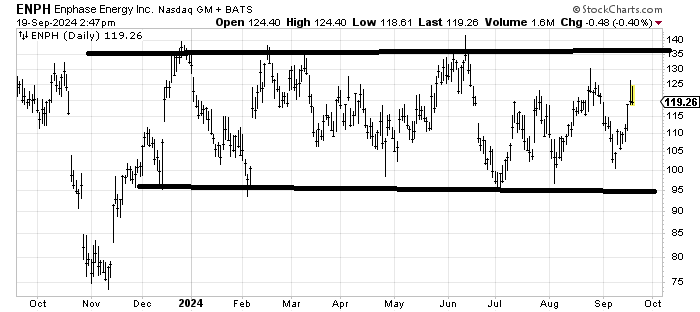
Enphase Not Yet in the Right Phase: I am trying to decide if Enphase Energy ENPH is a chart similar to the Expanded Tech Software exchange-traded fund IGV or the Nasdaq Next Gen 100 ETF QQQJ charts that I have liked. For now, I’ll just say it is in a trading range, but if it can mill around between $115-$125 for a week or so, I might warm up to it. Right here, it feels like it’s got work to do.
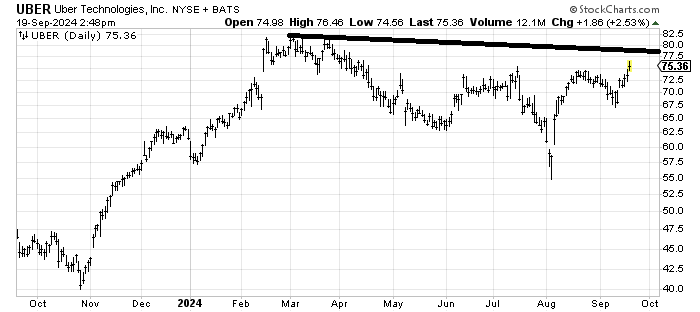
Uber's Driving Into Resistance: I turned more positive on Uber UBER in early August when it gapped up and left that island down below. The chart hasn’t done anything wrong, but it is heading into resistance in the $78-$80 area, so if you are trading it, I’d be inclined to take a little something off the table there.