The Market Enters Short-Term Oversold as We Await the Fed
The question is, will the market continue to follow our playbook? We also look at UNG, NOC< LHX, FCX, and SMG.
You've reached your free article limit
You've read 0 of 1 free Pro articles.
The Market
We didn’t quite get the hysteria I thought we would when indexes broke their 50-day moving average. But we are into a short-term oversold area now. You have to squint to see it on the chart of the NYSE, but for Nasdaq it is more obvious.
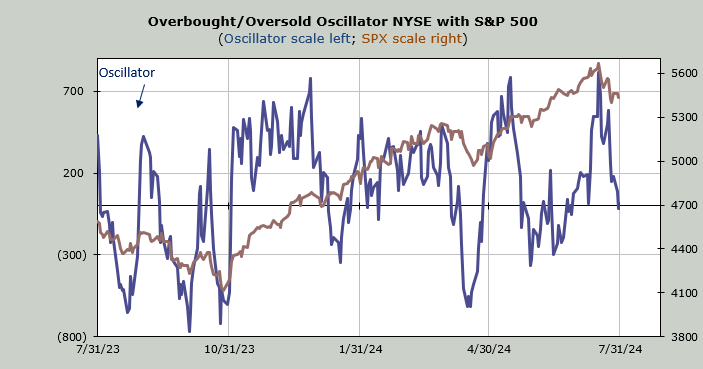
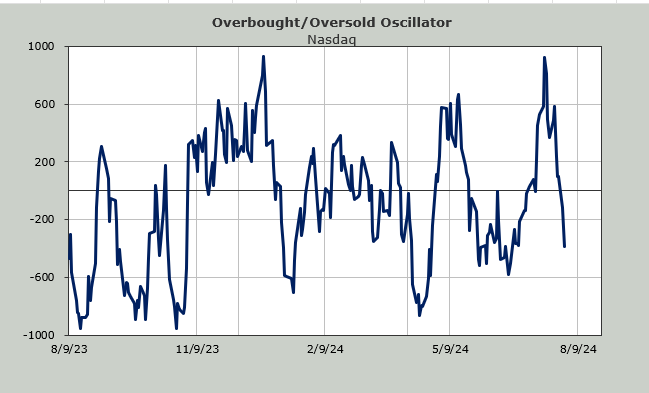
The cautiousness we saw creeping into the market last week in terms of put buying has extended this week. After not seeing a put/call ratio over 1.0 for nearly two months we’ve now had two such readings in the last three trading days. It has lifted the ten-day moving average of the put/call ratio enough where you need not squint to see it.
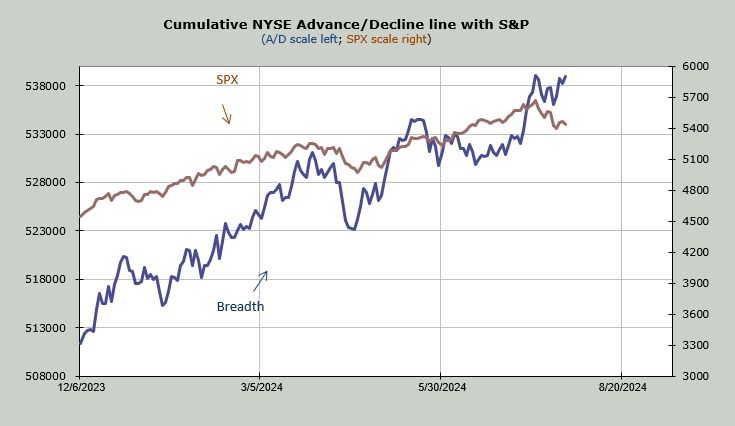
In terms of breadth, it has been positive for the NYSE but not so much for Nasdaq. Take a look at the divergence in the NYSE breadth (blue) and the S&P (brown).
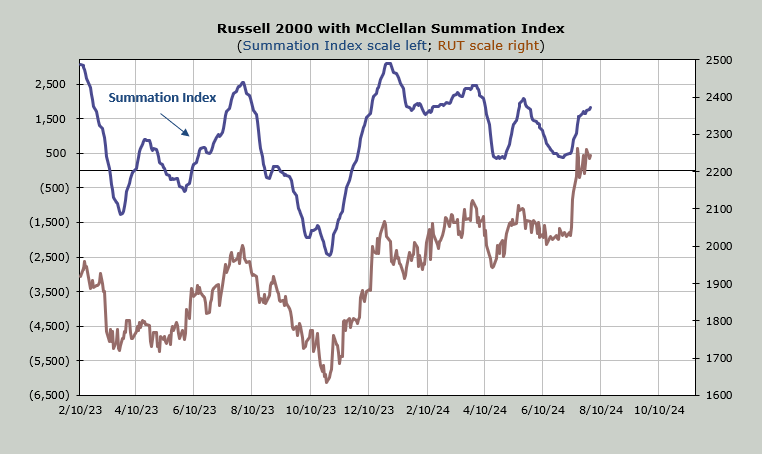
It hasn’t thoroughly translated into the McClellan Summation Index, though. It is still creeping higher, but one day where net breadth is -800 (advancers minus decliners) and the Summation Index will roll right back over. The chart is down below.
For Nasdaq, where I use volume instead of the a/d line, you can see it began rolling over a few weeks ago, tried to head up again, and is now heading back down.
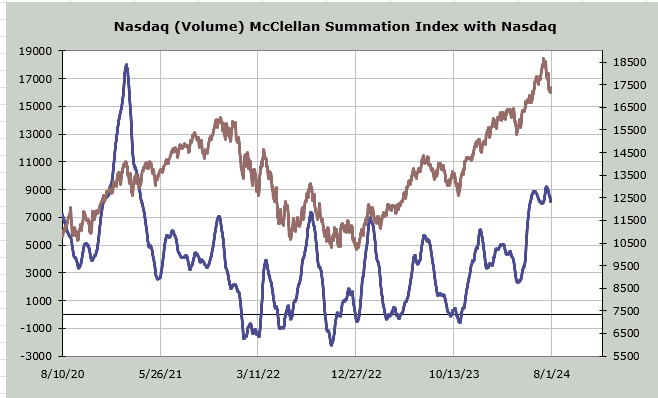
I’m still looking for one more rally but I don’t want to get comfortable since the intermediate term indicators are now in overbought territory, or will be by the end of the week. Let’s see if the Fed can give us that last lift up.
New Ideas
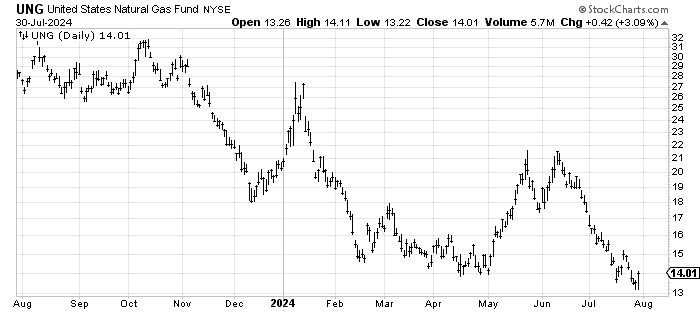
A few months ago I was asked about UNG, an etf to be long Natural Gas. It did what Natty tends to do: pop and drop. They call it a widow maker. But I noticed it is all the way back down with a nice reversal today. I think it’s worth a trade.
Today’s Indicator
The McClellan Summation Index is discussed in full above.
Q&A/Reader’s Feedback
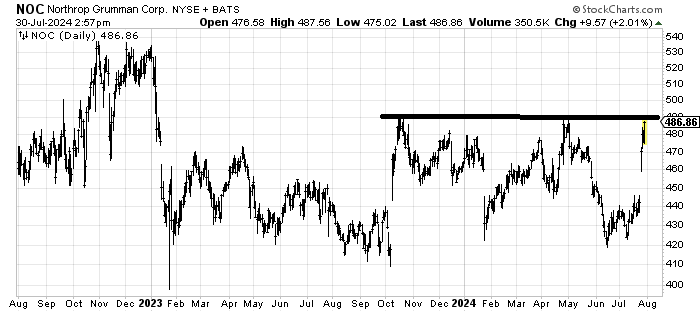
Northrup Grumman NOC which I have tried to bottom fish in for two years now finds itself back at the resistance/breakout level. I think I would prefer to see it back off or go sideways before breaking out. In the short term I would take something off the table just because it has run 15% in a straight line. If it can get over 490-ish I think it runs into trouble 510 but at least then we’d be looking to buy dips.
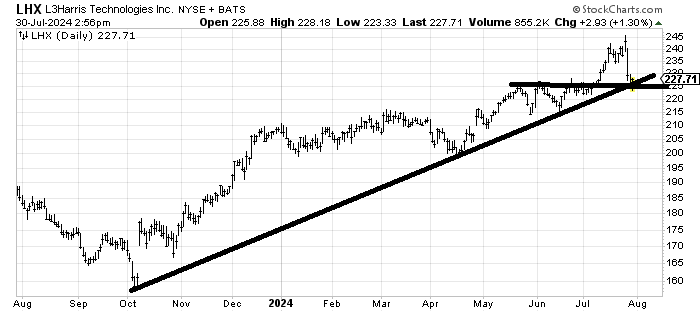
L3Harris LHX should rally off this support but I suspect it doesn’t go very far. That drop from last week will need to be worked out. For now, on a trading basis I’m a seller on a rally.
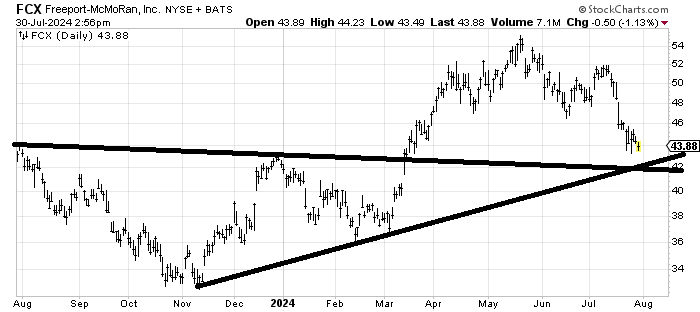
I have had a measured target on Freeport McMoRan FCX around 40-42 for quite some time (the head and shoulders top measures there). However notice that it has tried to break 43 over the last week or so and hasn’t been able to. With the DSI on copper at 10 I think I would start nibbling and leave some room to add should it drop into the 40-42 area.
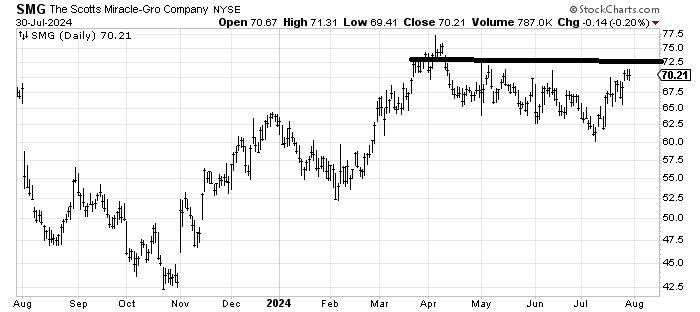
Generally speaking I like the chart of Scotts Miracle-Gro SMG but if it cannot get through that resistance at 72-73 like it means it I would not overstay my welcome.