Teva Makes My Anticipated Upside Breakout as Trend Strength Improves
Let's check and see how my trade is going.
You've reached your free article limit
You've read 0 of 1 free Pro articles.
We reviewed Teva Pharmaceutical TEVA on July 24 writing that "Traders could go long TEVA in the $17-$16 area risking to $15. On the upside my price target is the $35 area."
Let's check and see how that trade is going.
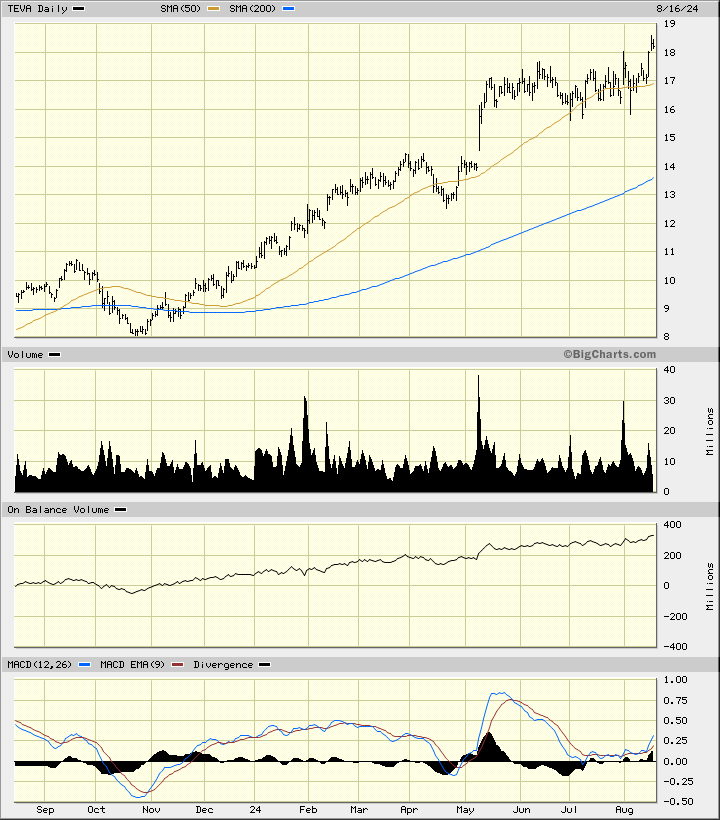
In the updated daily bar chart of TEVA, below, I can see that traders had a number of chances to buy shares of TEVA in the $17-$16 area. With prices now trading at $18, stops could be raised to $16 from $15. TEVA trades above the rising 50-day moving average line and the rising 200-day line.
The On-Balance-Volume (OBV) line still shows a nice and steady rise from October and supports the price gains we have seen so far. The Moving Average Convergence Divergence (MACD) oscillator has turned higher from above the zero line telling me that the trend strength has improved.
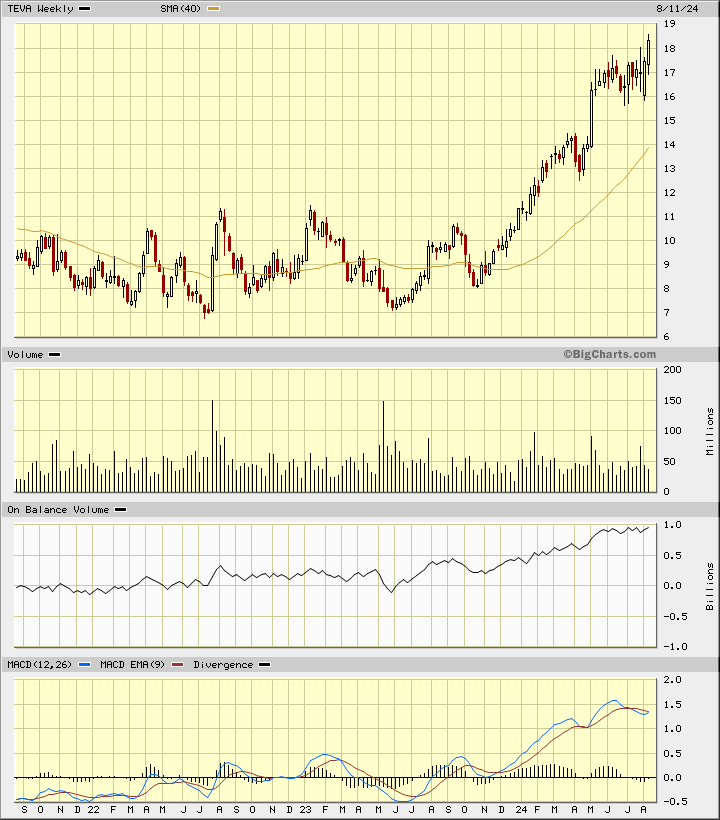
In the weekly Japanese candlestick chart of TEVA, below, I can see a bullish setup. Prices trade above the rising 40-week moving average line. Trading volume has remained steady.
The weekly OBV line has moved to the upside since last May. The MACD oscillator is above the zero line and poised for a fresh outright buy signal.
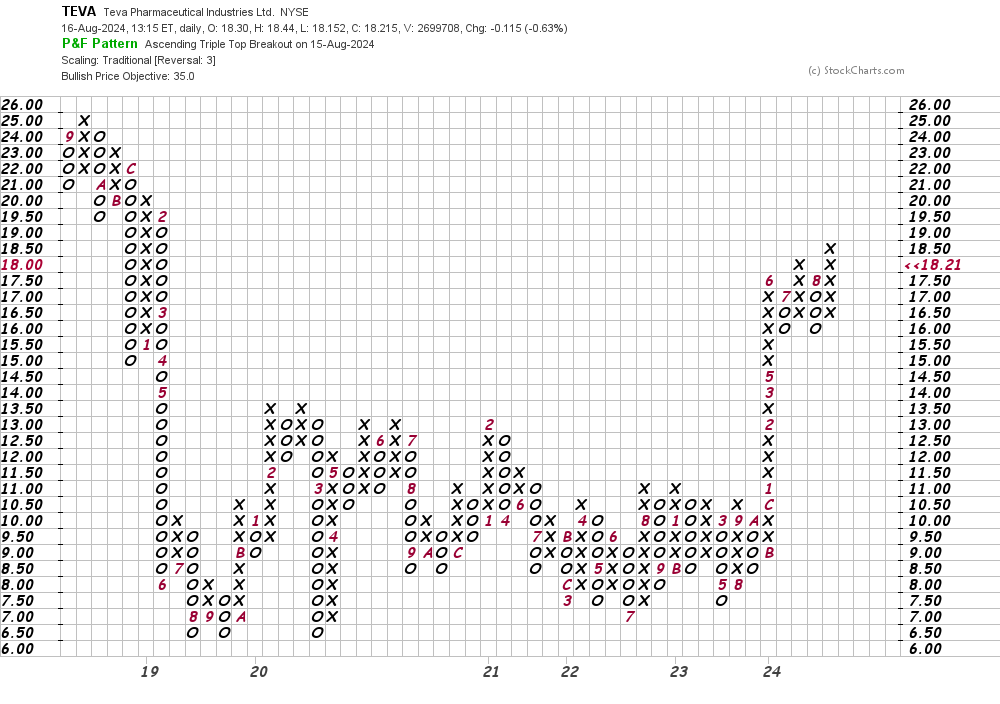
In this daily Point and Figure chart of TEVA, below, I can see an upside price target in the $35 area.
In this weekly Point and Figure chart of TEVA, below, I used a five-box reversal filter and here the software suggests we could see an advance to the $62 area.
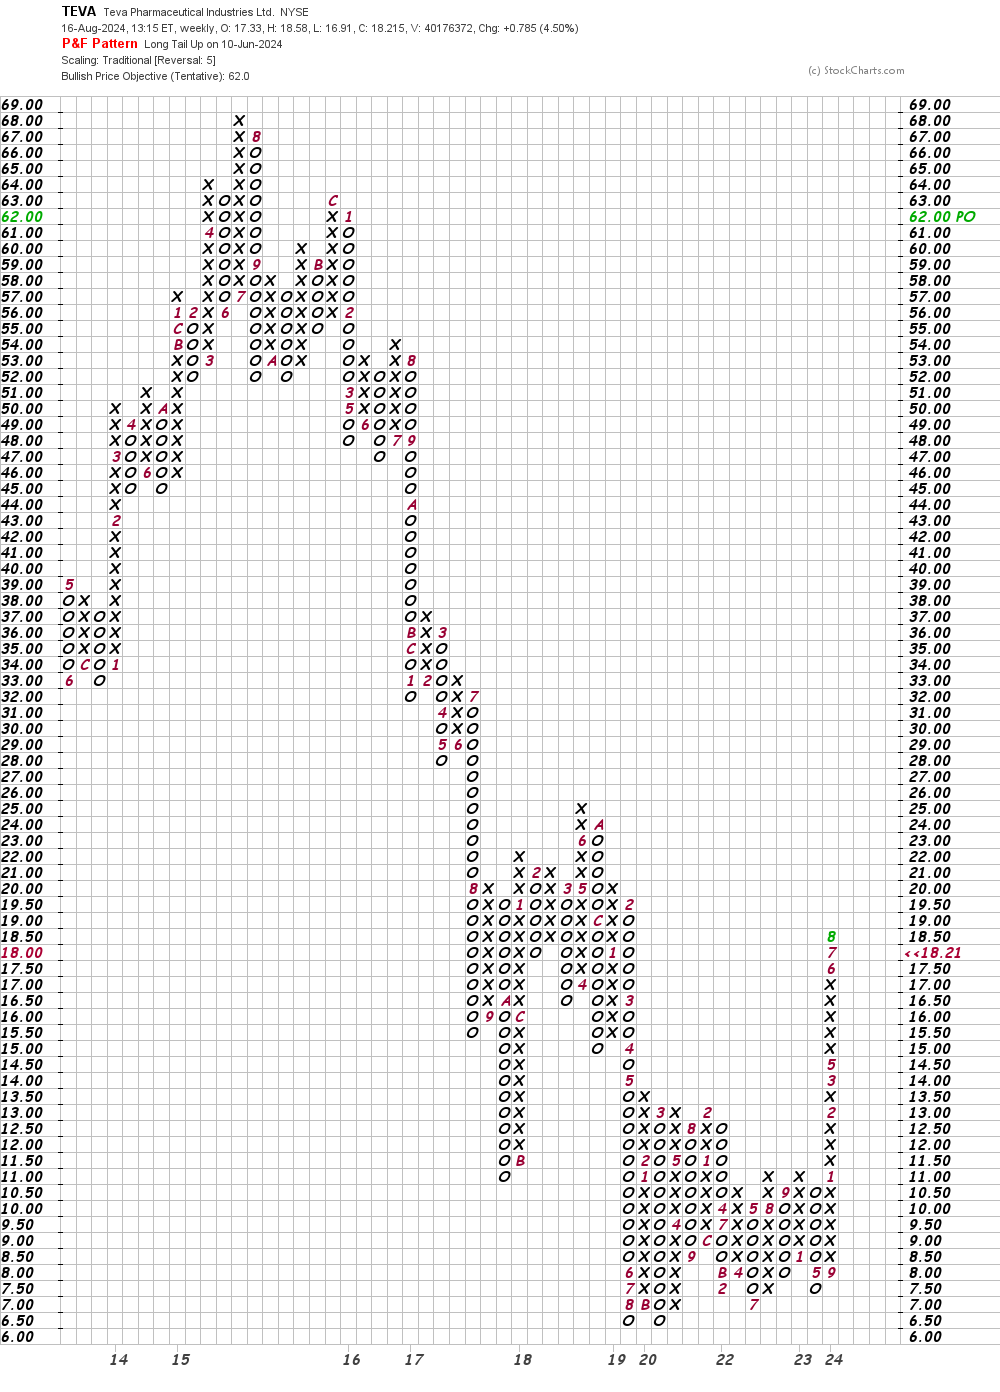
Bottom-line strategy: Traders who are long TEVA should continue to hold those positions. Add to longs on strength if you like. Again, raise your sell stop to $16. My intermediate-term price target is $35 and $62 is a long-term price objective.
Employees of TheStreet are prohibited from trading individual securities.